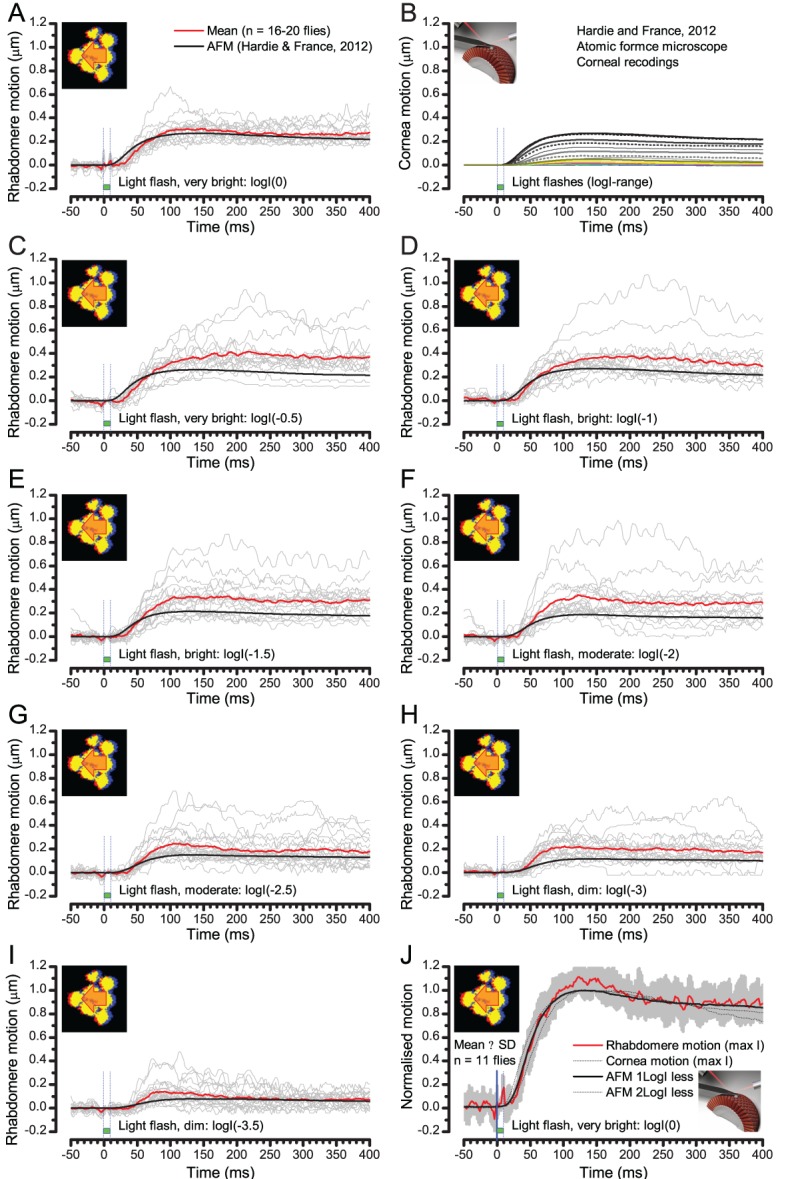
Appendix 7—figure 9. Comparing optically resolved wild-type rhabdomere movements to corresponding atomic force microscope (AFM) recordings from the corneal surface.

To ease the comparisons, the AFM data is inverted. (A) Rhabdomere motion within individual ommatidia (grey thin traces) and their mean (red) evoked by the brightest 10 ms test flash are plotted against the largest AFM recording (black) to the brightest 5 ms test flash (data from Hardie and Franze, 2012). The rhabdomere movement range is larger than what the AFM data suggests. (B) AFM recordings to a broad logarithmic light flash intensity range. (C–I Rhabdomere movements vs. AFM recordings to light flashes of broadly comparable diminishing intensities. Notice that some individual rhabdomere movement recordings show minor oscillations that could be related to recording noise or physiological activity. (J) the mean and SD of normalized rhabdomere movements to the brightest test flash are compared with the normalized AFM recordings to three different test flash intensities. All these AFM recordings fall within the SD of the given rhabdomere recordings.
