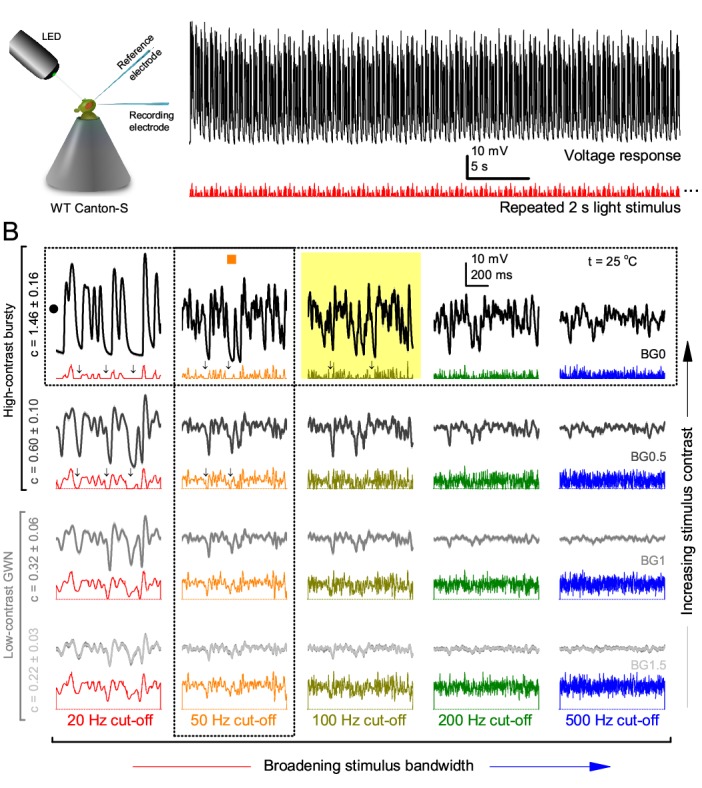
Figure 1. Photoreceptors respond best to high-contrast bursts.
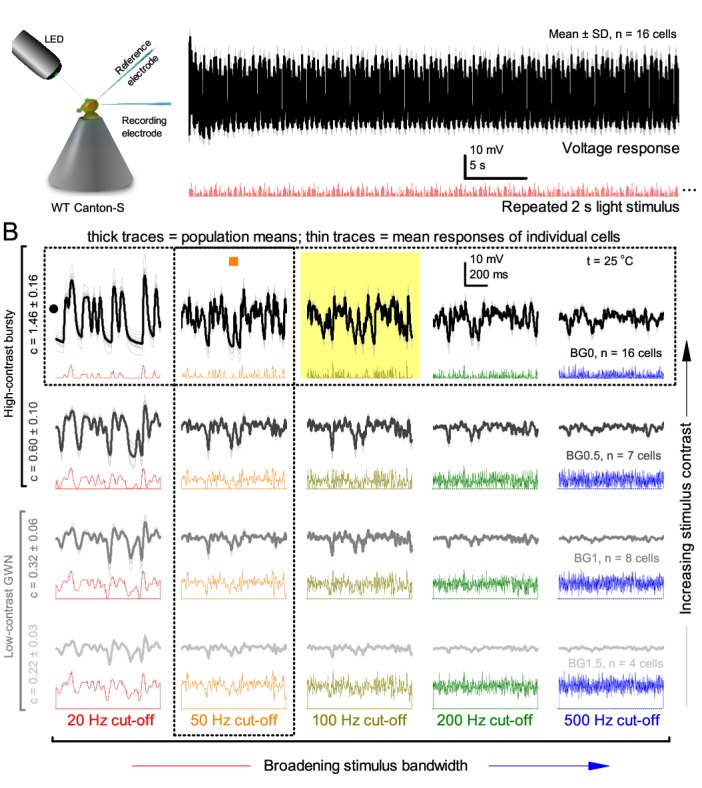
(A) Schematic of intracellular recordings to repeated bursty light intensity time series (20 Hz bandwidth). Responses changed little (minimal adaptation) during bursts. (B) Testing a R1-R6 photoreceptor’s diurnal encoding gamut. Means (thick traces) and 20 individual responses (thin; near-perfectly overlapped) to 20 different stimuli; each with a specific bandwidth (columns: from 20 Hz, red, to 500 Hz, blue) and mean contrast (rows). Reducing the background (BG) of Gaussian white-noise stimuli (GWN; 2-unit peak-to-peak modulation) from bright (1.5-unit, bottom) to dark (0-unit, top) halved their modulation, generating bursts of increasing contrast: the lower the BG, the higher the contrast. Left-top: responses from (A). Yellow box: maximum information responses. Arrows: dark intervals. Because of half-Gaussian waveforms, light bursts carried fewer photons (see Figure 2—figure supplement 3). Yet their larger responses comply with the stochastic adaptive visual information sampling theory (Song et al., 2012; Song and Juusola, 2014; Juusola et al., 2015) (Appendixes 1–3), whereby dark intervals rescue refractory microvilli for transducing high-frequency (1–20 ms) saccadic photon surges (of high contrast) into quantum bumps efficiently. Thus, larger responses would incorporate more bumps. Recordings are from the same photoreceptor. Vertical dotted rectangle (orange square) and horizontal rectangle (black circle): responses for contrast and bandwidth analyses in Figure 2A. Similar R1-R6 population data is in Figure 1—figure supplement 1.

Figure 1—figure supplement 1. R1-R6 output varies more cell-to-cell than trial-to-trial (cf.Figure 1) but show consistent stimulus-dependent dynamics over the whole encoding range.

