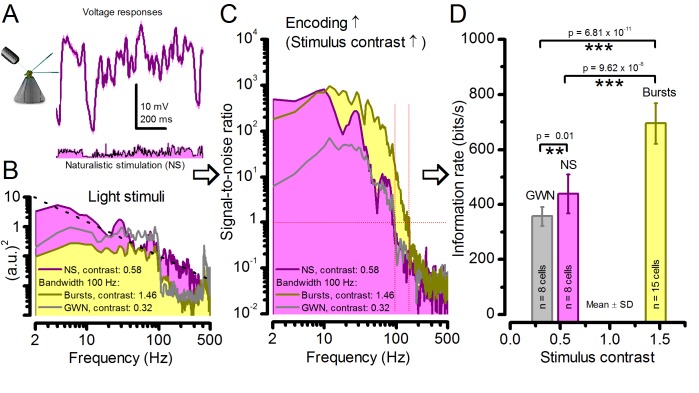
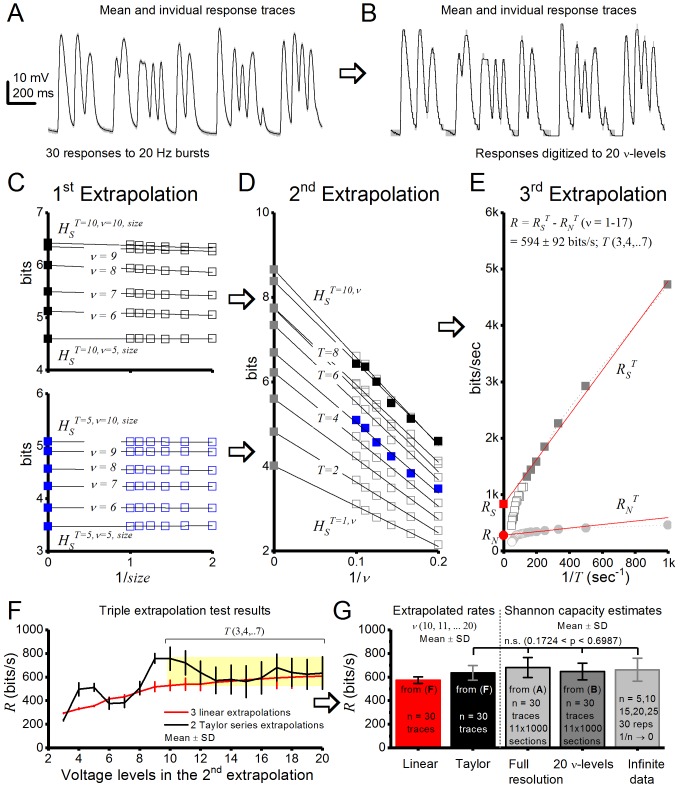
Figure 2. High-contrast bursts drive maximal encoding.
A R1-R6’s information transfer to high-frequency 100 Hz bursts exceeded 2-to-4-times the previous estimates. (A) Response signal-to-noise ratio (SNR, left) to 20 (red), 100 (yellow) and 500 Hz (blue) bursts, and to 50 Hz bandwidth stimuli of different contrasts (right); data from Figure 1. SNR increased with contrast (right), reaching the maximum (~6,000) for 20 Hz bursts (left, red) and the broadest frequency range for 100 Hz bursts (yellow). (B) Skewed bursts drove largely Gaussian responses (exception: 20 Hz bursts, red), with 100 Hz bursts evoking the broadest amplitude range (yellow). (C) Information transfer peaked for 100 Hz stimuli, irrespective of contrast (or BG; left), having the global maximum of ~850 bits/s (capacity, infomax) for the high-frequency high-contrast bursts. (D) Encoding efficiency, the ratio between input and output information (Routput/Rinput), was > 100% for 20 Hz bursts. Extra information came from the neighboring cells. Rinput at each BG was determined for the optimal mean light intensity, which maximized a biophysically realistic photoreceptor model’s information transfer (Appendix 2). Encoding efficiency fell with stimulus bandwidth but remained more constant with contrast. Population dynamics are in Figure 2—figure supplement 1.
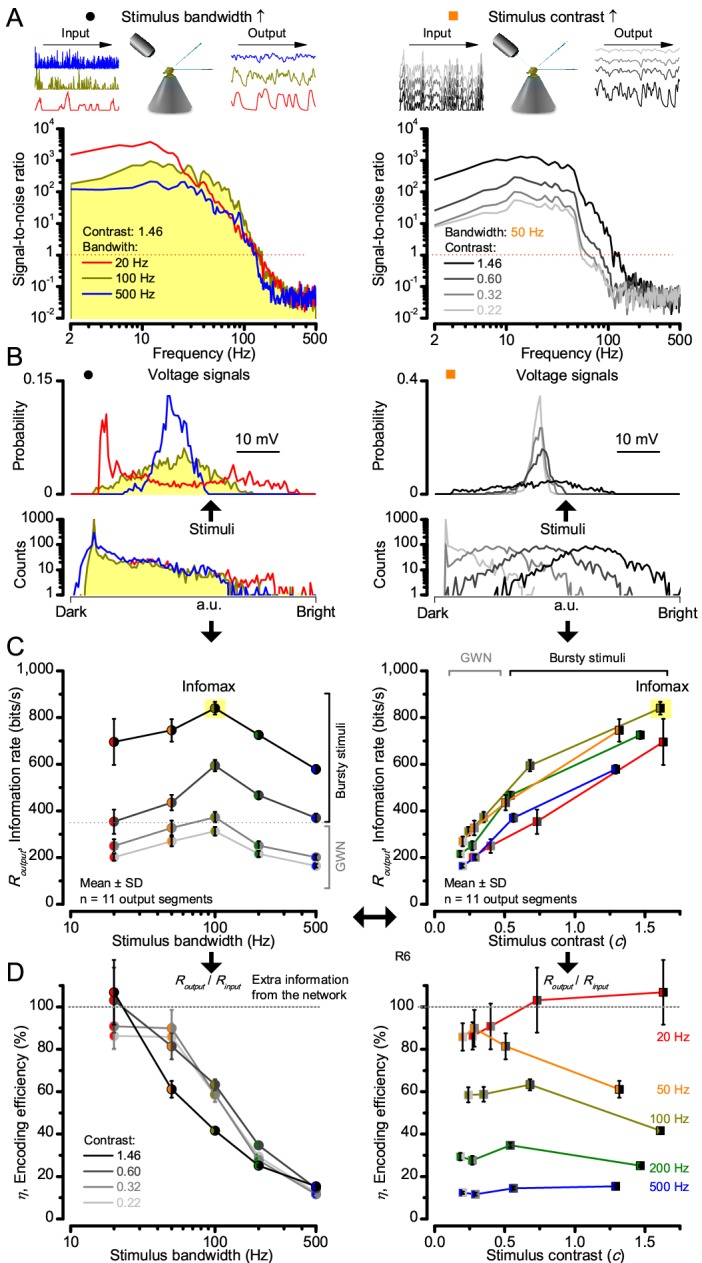
Figure 2—figure supplement 1. Signaling performance vary cell-to-cell but adapts similarly to given stimulus statistics.
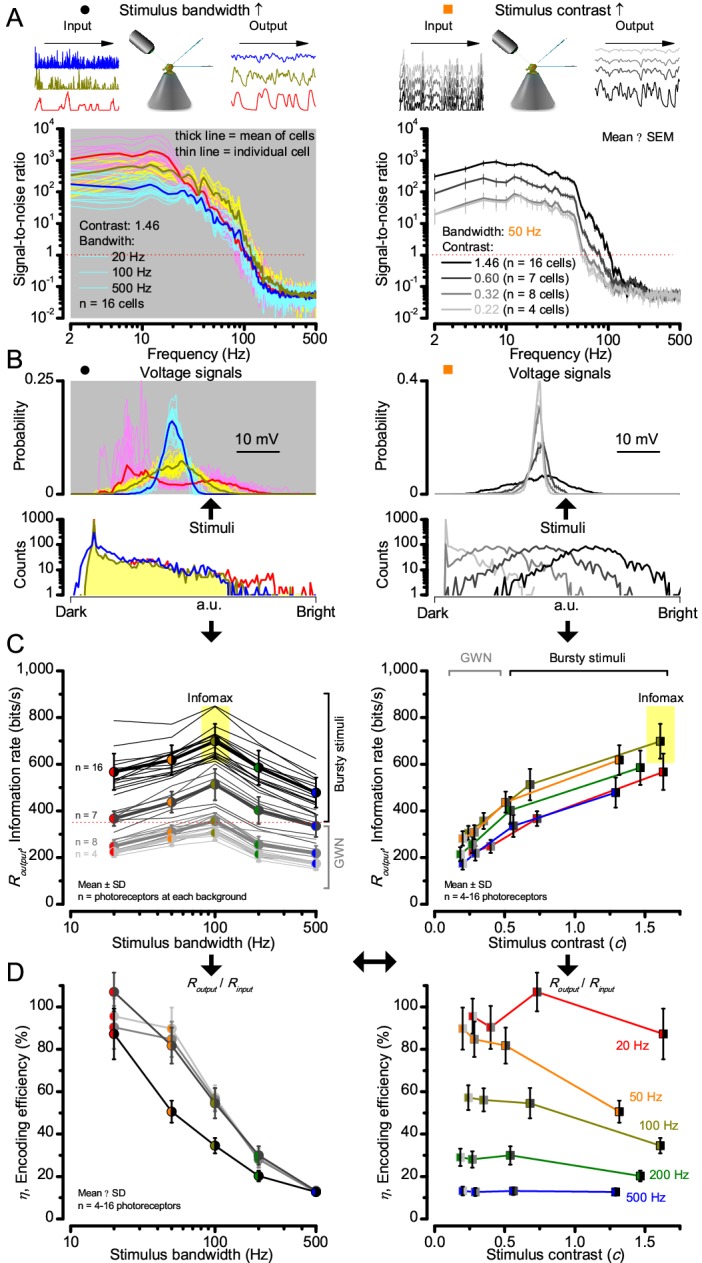
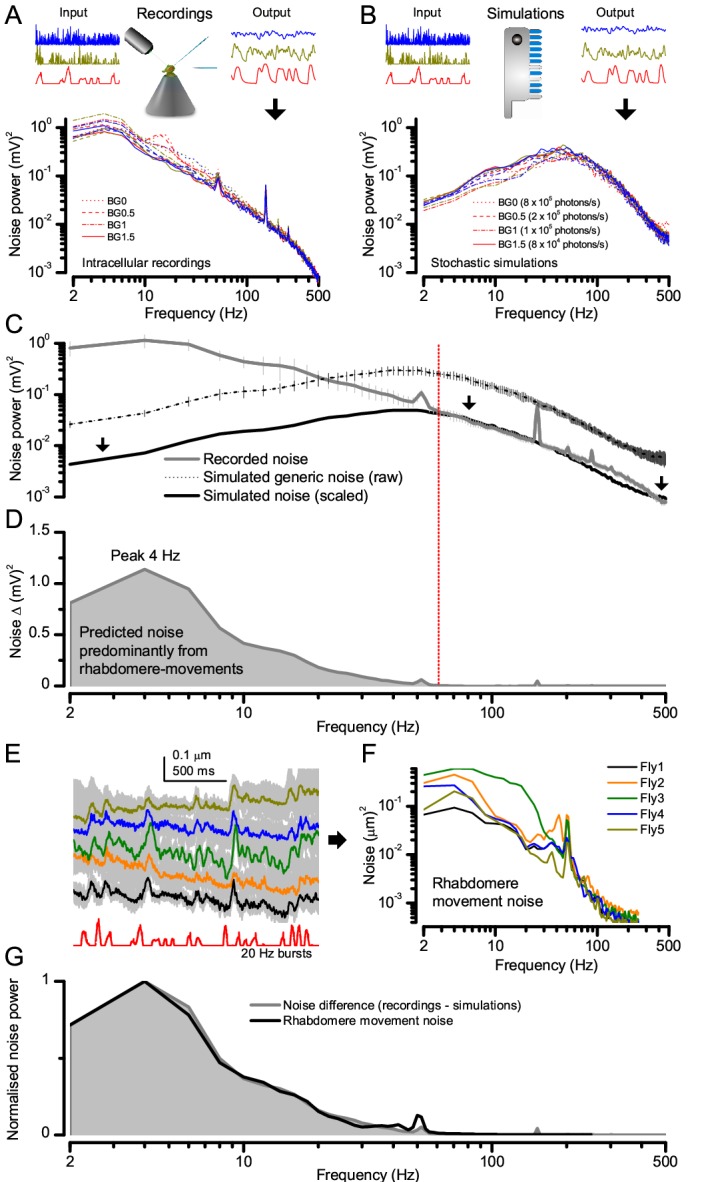
Figure 2—figure supplement 2. Light-adapted R1-R6 noise is similar for all the test stimuli, with its high-frequencies reflecting the mean quantum bump shape and its low-frequencies the rhabdomere jitter.
