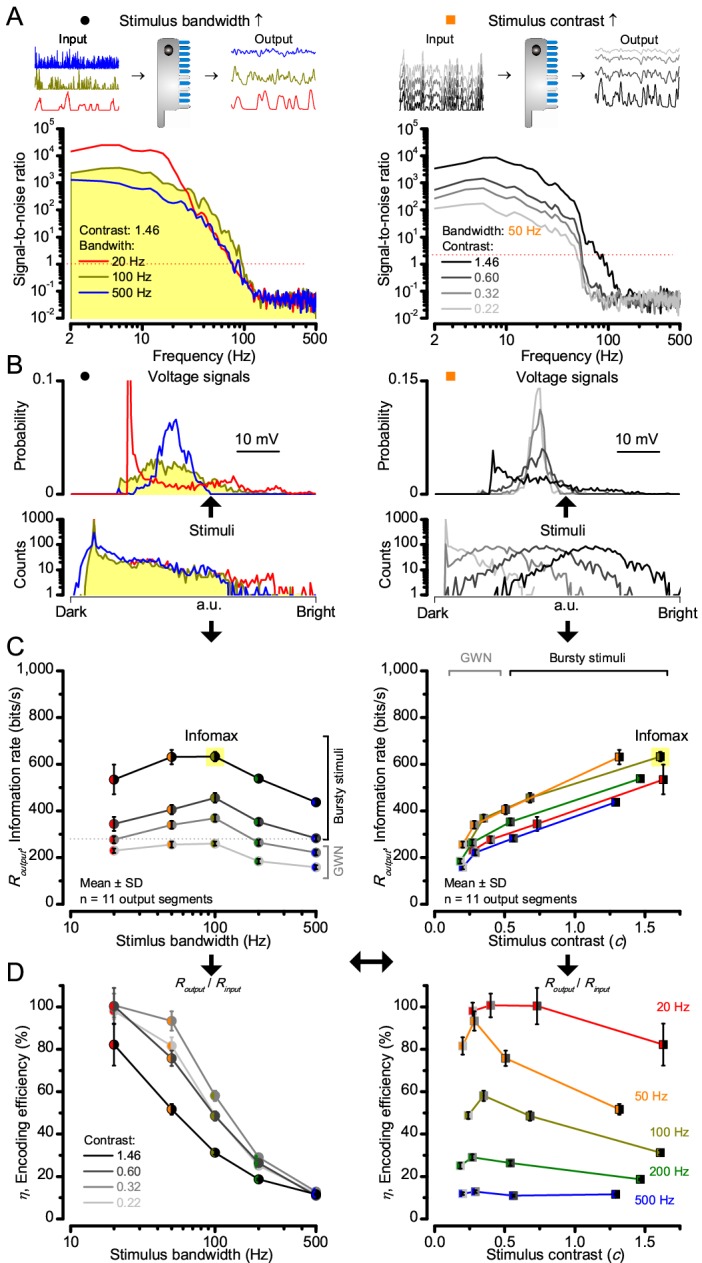
Figure 4. Model encodes light information realistically.

Encoding capacity of a stochastic photoreceptor model peaks to high-contrast bursts with 100 Hz cut-off, much resembling that of the real recordings (cf. Figure 2). (A) Inserts show simulations for the bursty input patterns of similar high contrast values (left) that drove its responses (outputs) with maximum information transfer rates. Output signal-to-noise ratios peaked for 20 Hz bursts (red), but was the broadest for 100 Hz bursts (yellow). Signal-to-noise ratio rose with stimulus contrast (right). (B) The corresponding probability density functions show that 100 Hz bursts evoked responses with the broadest Gaussian amplitude distribution (yellow). Only responses to low-frequency bursts (20–50 Hz) deviated from Gaussian (skewed). (C) Information transfer of the model output reached its global maximum (infomax) of 632.7 ± 19.8 bits/s (yellow) for 100 Hz (left) bursts (right). Corresponding information transfer for Gaussian white-noise stimuli was significantly lower. (D) Encoding efficiency peaked for low-frequency stimuli (left), decaying gradually with increasing contrast. For details see Appendix 2.
