. 2017 Sep 5;6:e26117. doi: 10.7554/eLife.26117

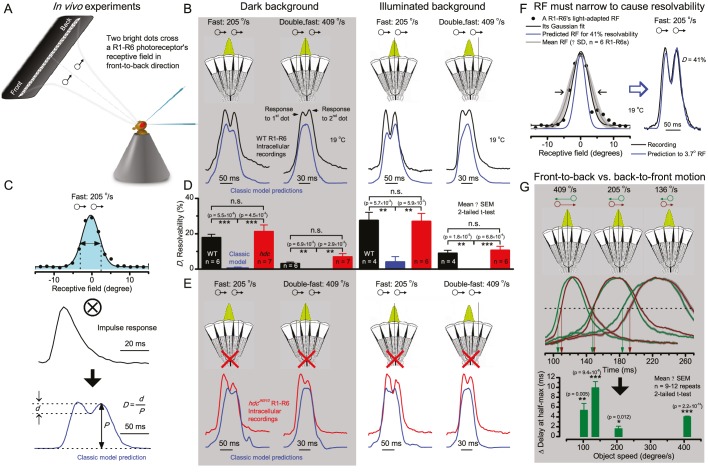
Figure 7. Photoreceptors resolve dots at saccadic velocities far better than the classic models.

(A) 25-light-point stimulus array centered at a R1-R6’s receptive field (RF). Each tested photoreceptor saw two bright dots, 6.8o apart, travelling fast (205 o/s) or double-fast (409 o/s) in front-to-back direction. (B) Responses (black), both at dark (left) or illuminated backgrounds (right), characteristically showed two peaks. In contrast, the corresponding classic model simulations (blue) rarely resolved the dots. (C) In the simulations, each photoreceptor’s receptive field (or its Gaussian fit) was convolved with its impulse response (first Volterra kernel). The resolvability, D, of the recordings and simulations, was determined by Raleigh criterion. (D) Recordings outperformed simulations. (E) hdcJK910 R1-R6s (red), which lacked the neurotransmitter histamine, and so network modulation, resolved the dots as well as the wild-type, indicating that the recordings’ higher resolvability was intrinsic and unpredictable by the classic models (Appendix 6). (F) To resolve the two dots as well as a real R1-R6 does in light-adaptation, the model’s acceptance angle (∆ρ) would need to be ≤3.70o (blue trace); instead of its experimentally measured value of 5.73 (black; the narrowest ∆ρ. The population mean, grey, is wider). (G) Normalized responses of a typical R1-R6 to a bright dot, crossing its receptive field in front-to-back or back-to-front at different speeds. Responses to back-to-front motions rose and decayed earlier, suggesting direction-selective encoding. This lead at the half-maximal values was 2–10 ms. See Appendixes 4 and 6.

Figure 7.

Figure 7—figure supplement 1. Dark-adapted wild-type and hdcJK910 R1-R6s’ acceptance angles differ marginally.
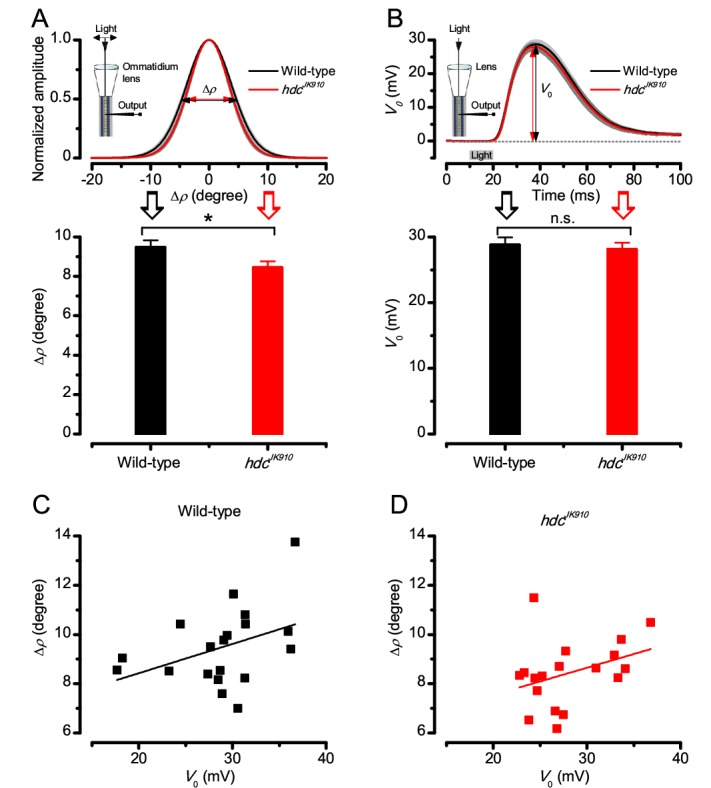
Figure 7—figure supplement 1.

The receptive field of each tested cell was estimated as in Appendix 4, Appendix 4—figure 2. (A) Dark-adapted wild-type photoreceptors’ receptive fields (above), shown as the mean of their Gaussian fits (black), were ~11% wider than those of hdcJK910 photoreceptors (red). Their receptive field sizes (below) were quantified by the corresponding half-maximum widths, giving the mean acceptance angles: ∆ρwild-type = 9.47 ± 0.36°; ∆ρhdc = 8.44 ± 0.32°; p=0.0397, two-tailed t-test. (B) Wild-type and mutant photoreceptors’ peak responses (above), evoked by a sub-saturating 10 ms light flash (grey bar) at the center of the receptive field, showed similar dynamics and amplitudes, V0 (below). V0wild-type = 28.77 ± 1.19 mV; V0hdc = 28.11 ± 1.03 mV; p=0.67, two-tailed t-test. This indicates that hdcJK910 phototransduction is functionally intact and wild-type-like. See also (Dau et al., 2016). (C) Linear correlation between ∆ρ and V0 of dark-adapted wild-type photoreceptors. Adjusted R-squared = 0.1043. (D) Linear correlation between ∆ρ and V0 of dark-adapted hdcJK910 photoreceptors. Adjusted R-squared = 0.072. (A-D) nwild-type = 19; nhdc = 18. (A, B) Mean ± SEM; two-tailed t-test.
Figure 7—figure supplement 2. Light-adaptation narrows wild-type and hdcJK910 R1-R6s’ receptive fields similarly.
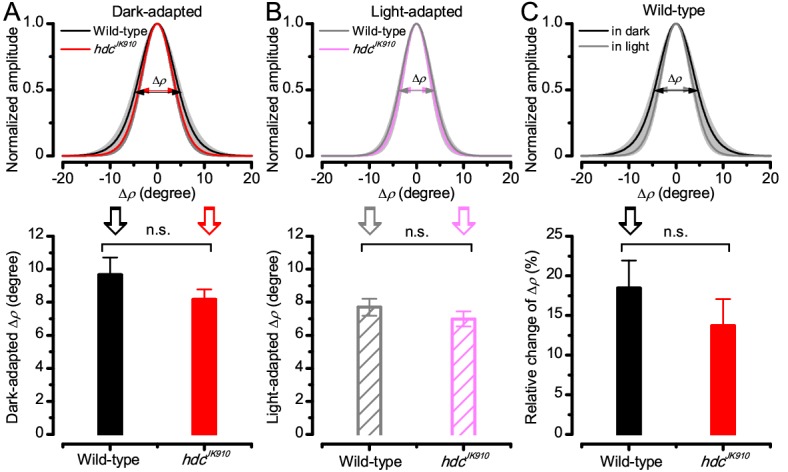
Figure 7—figure supplement 2.

Comparing wild-type and hdcJK910 photoreceptors, of which receptive fields were assessed in both the dark- and light-adapted states. (A) Their dark-adapted and (B) and light-adapted ∆ρ values were similar. Dark-adapted: ∆ρwild-type = 9.65 ± 1.06°; ∆ρhdc = 8.16 ± 0.62°; p=0.258, two-tailed t-test. Light-adapted: ∆ρwild-type = 7.7 ± 0.52°; ∆ρhdc = 6.98 ± 0.46°; p=0.323, two-tailed t-test. (C) Predictably, their receptive fields narrowed during light-adaptation (only wild-type shown). The relative changes between the two adaptation states between were statistically similar in wild-type and hdcJK910 photoreceptors. Relative changes, calculated as C=ρDarkρLightρDark×100%. Cwild-type = 18.44 ± 3.5%; Chdc = 13.68 ± 3.37%, p=0.347, two-tailed t-test. A-C: Mean ± SEM; nwild-type = 6; nhdc = 8 cells.