. 2017 Jul 27;6:e25690. doi: 10.7554/eLife.25690

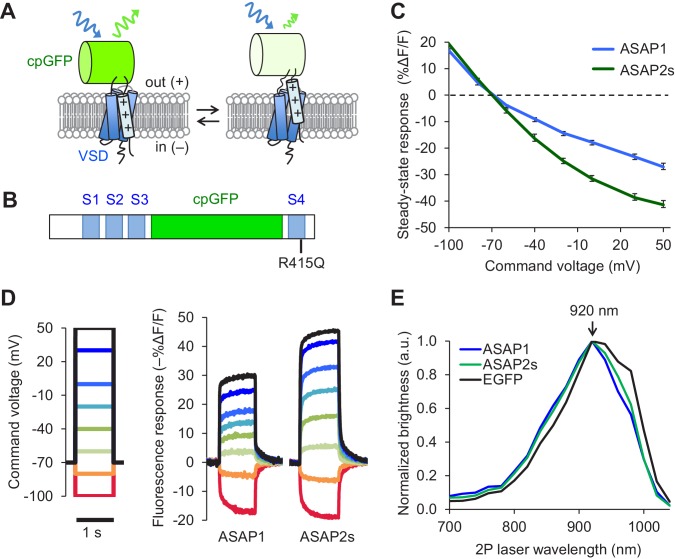
Figure 1. Design and in vitro characterization of ASAP2s.

(A) In ASAP-type sensors, voltage-induced movement of a positively charged transmembrane helix of a voltage-sensing domain (VSD) is thought to perturb the protonation state of a circularly permuted GFP (cpGFP), resulting in changes in fluorescence emission. (B) Schematic diagram of ASAP1, showing the VSD transmembrane domains (S1 to S4, blue), cpGFP, and the location of the new mutation in ASAP2s (R415Q). (C) Mean fluorescence responses to voltage steps (n = 6 HEK293A cells for ASAP1 and n = 5 for ASAP2s). Error bars are standard error of the mean (SEM). Responses are reported as the fluorescence change (ΔF) normalized by the initial fluorescence (F), expressed as a percentage of the initial fluorescence (% ΔF/F). (D) Representative fluorescence responses of ASAP1 and ASAP2s to voltage steps from −100 to 50 mV. Responses were measured at 5 ms intervals and were normalized to the fluorescence at the −70 mV holding potential. (E) Two-photon excitation spectra of ASAP1, ASAP2s, and EGFP. All proteins were expressed in HEK293-Kir2.1 cells with resting membrane potential of ~-77 mV. Brightness was evaluated every 20 nm from 700 to 1040 nm. Each spectrum was normalized to its peak brightness. Traces are the mean of >30 cells.

DOI: http://dx.doi.org/10.7554/eLife.25690.002

Figure 1.

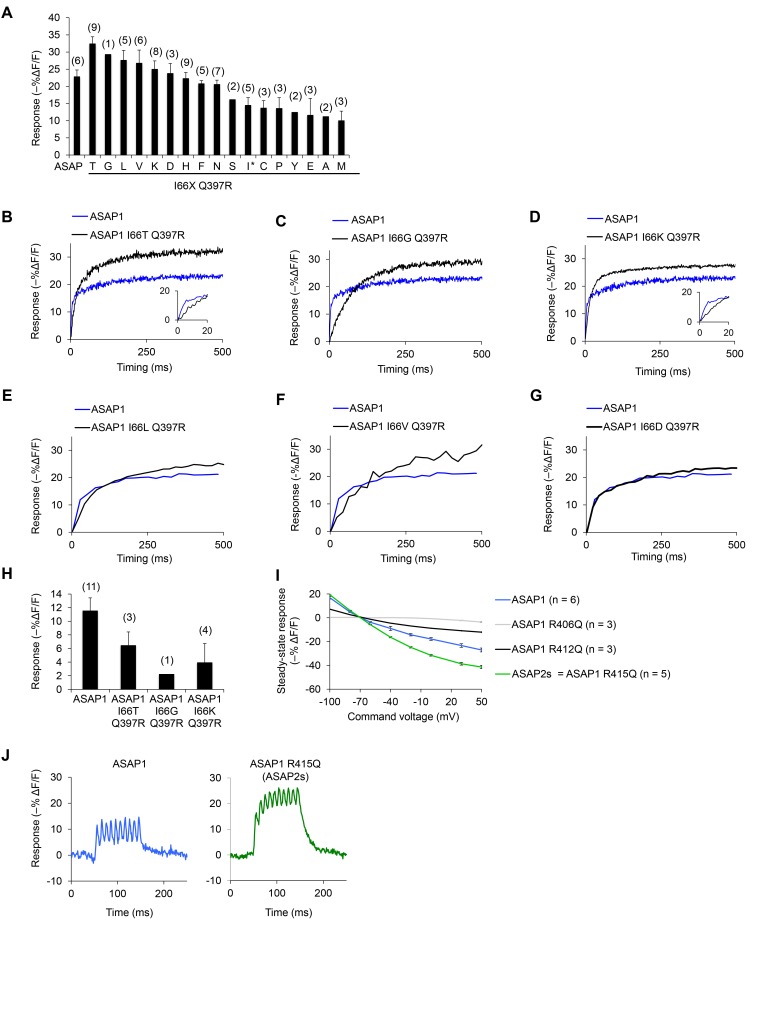
Figure 1—figure supplement 1. In vitro characterization of candidate GEVIs based on ASAP1.

Figure 1—figure supplement 1.

(A) Mean maximal response of ASAP1 variants to 500 ms, 100 mV steps in HEK293A cells from a holding potential of −70 mV. The x-axis labels represent the amino acid substituted in the place of I66 in ASAP1 I66X Q397R variants. We restored the wild-type amino acid at position 397 (arginine) since this is the genetic background used by Lacroix and colleagues when evaluating the importance of the residue homologous to I66 in the voltage-sensing domain from the sea squirt voltage-sensitive phosphatase (Lacroix and Bezanilla, 2012). The asterisk denotes the original amino acid at position 66 (isoleucine). Variants where isoleucine was replaced with arginine or tryptophan did not produce fluorescence at the membrane. The variant with glutamine (Q) expressed poorly and was not tested. Error bars are ±1 SEM. The number of cells tested is shown in parentheses above the bars. (B–H) The improved response amplitude of variants in panel A is due to a larger slow component. Representative fluorescence responses of selected ASAP1 variants to voltage steps from −70 mV to +30 mV (panels B-D) or −70 mV to −10 mV (panels E-G). Insets, fluorescence response during the first 20 ms. (H) Mean maximal response of selected ASAP1 variants to an artificial action potential waveform (4.0 ms full width at half–maximum, 100 mV peak amplitude) in HEK293A cells from a holding potential of −70 mV. Error bars are ±1 SEM. The number of cells tested is shown in parentheses above the bars. (I) Mean response of ASAP1 variants to transmembrane voltage in HEK293A cells from a holding potential of –70 mV. SEMs are small (0.2–1.2% in ΔF/F). Samples sizes (n) correspond to individual cells. (J) Responses of ASAP1 (left) and ASAP2s (right) to a 100 Hz series of 10 AP waveforms (4.0 ms full width at half–maximum, 100 mV peak amplitude) in HEK293A cells. Responses were collected for six cells (ASAP1) or five cells (ASAP2s), with representative traces shown here.
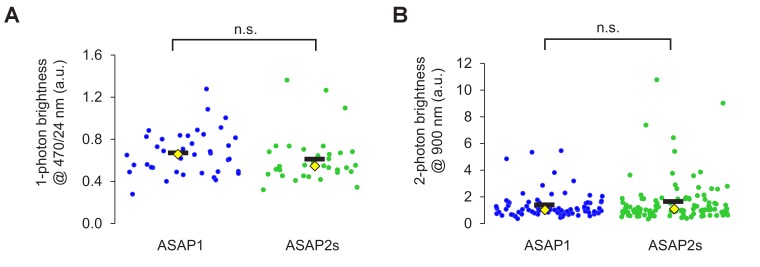
Figure 1—figure supplement 2. Brightness of ASAP sensors in immortalized cells.

Figure 1—figure supplement 2.

(A) One-photon relative brightness of ASAP1 and ASAP2s transiently expressed in HEK293-Kir2.1 cells. Cells were illuminated with 470/24 nm light, and emitted photons were filtered using a 520/23 nm filter. The brightness of each cell was normalized for variability in expression level by exciting a red fluorescent protein (FusionRed) genetically fused to the C-terminus of each indicator. FusionRed was excited with 555/15 nm light, and emitted photons were collected following a 597/39 nm filter. Individual cells are shown as circles. Black horizontal bars correspond to the mean, yellow lozenges correspond to the median. n = 39 (ASAP1) or 33 (ASAP2s) cells. n.s., p=0.09 (Mann-Whitney U test). (B) Two-photon brightness of ASAP1 and ASAP2s transiently expressed in HEK293-Kir2.1 cells. Cells were illuminated at 900 nm using a femtosecond pulsed Ti:sapphire (two-photon) laser, and emitted photons were filtered using a 525/50 nm filter. As in panel A, the brightness of each cell was normalized for variability in expression level by exciting a red fluorescent protein (FusionRed) genetically fused to the C-terminus of each indicator. FusionRed was excited with 1040 nm light, and emitted photons were filtered using a 605/70 nm filter. Individual cells are shown as circles. Black horizontal bars correspond to the mean, yellow lozenges correspond to the median. n = 81 (ASAP1) or 105 (ASAP2s) cells. n.s., p=0.66 (Mann-Whitney U test).
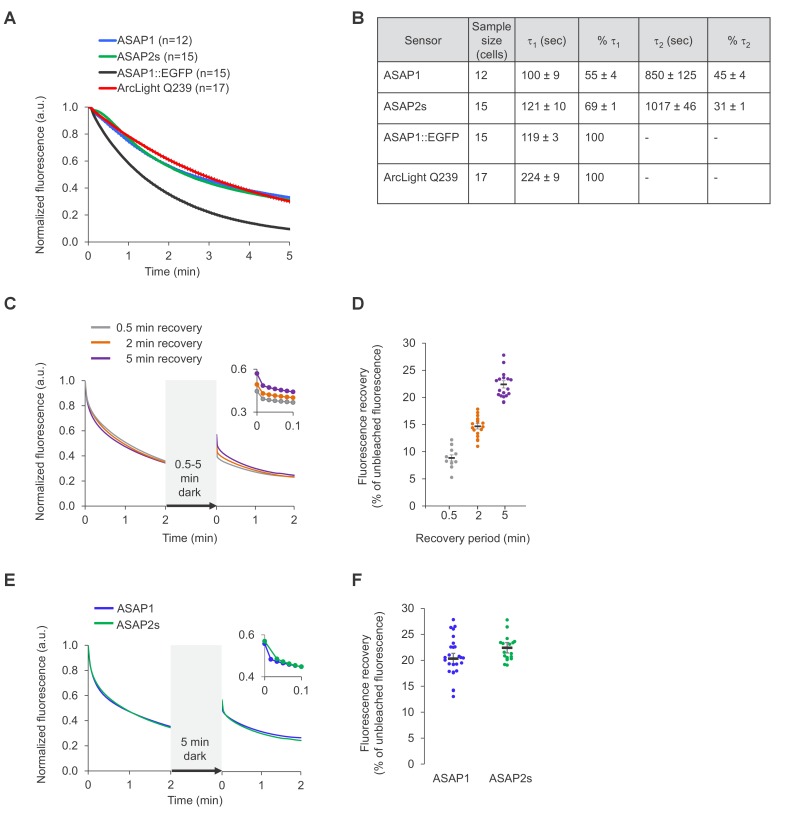
Figure 1—figure supplement 3. Photostability of ASAP sensors in immortalized cells under one-photon illumination.

Figure 1—figure supplement 3.

For all panels, HEK293-Kir2.1 cells transiently expressing the voltage indicators or the ASAP1::EGFP control were imaged under widefield one-photon illumination. (A) One-photon photobleaching kinetics. Cells transiently expressing a voltage indicator were continuously illuminated with 470 to 490 nm light at 11 mW/mm2 at the sample plane, and their fluorescence at 525/50 nm monitored. Photobleaching curves for ASAP1::EGFP were also obtained for comparison. Fluorescence was normalized to 1.0 at t = 0 and averaged over all cells (n). Error bars are SEM. (B) Photobleaching time constants for the data in (A). Values are mean ± 1 SEM. (C) Reversibility of one-photon photobleaching. Cells expressing ASAP2s were illuminated for 2 min, incubated in the dark for 0.5–5 min, and illuminated for another 2 min. Illumination was performed with 470/24 nm light at 88 mW/mm2 at the sample plane. Fluorescence was normalized to 1.0 at t = 0. Traces are mean responses. n = 13, 18, and 20 cells for the 0.5, 2 and 5 min incubations, respectively. The inset is a magnification of the first 6 s post-incubation. (D) Quantification of the fluorescence recovery in panel C. Circles are individual cells, black bars are the means, and error bars are the SEM. (E) Comparison of spontaneous fluorescence recovery of ASAP1 and ASAP2s following a 5-min incubation in the dark. The experiment was conducted as described in panel C. n = 26 and 20 cells for ASAP1 and ASAP2s, respectively. ASAP2s data is the same as in panel C. The inset is a magnification of the first 6 s post-incubation. (F) Quantification of the fluorescence recovery in panel C. Circles are individual cells, black bars are the means and error bars are the SEM.
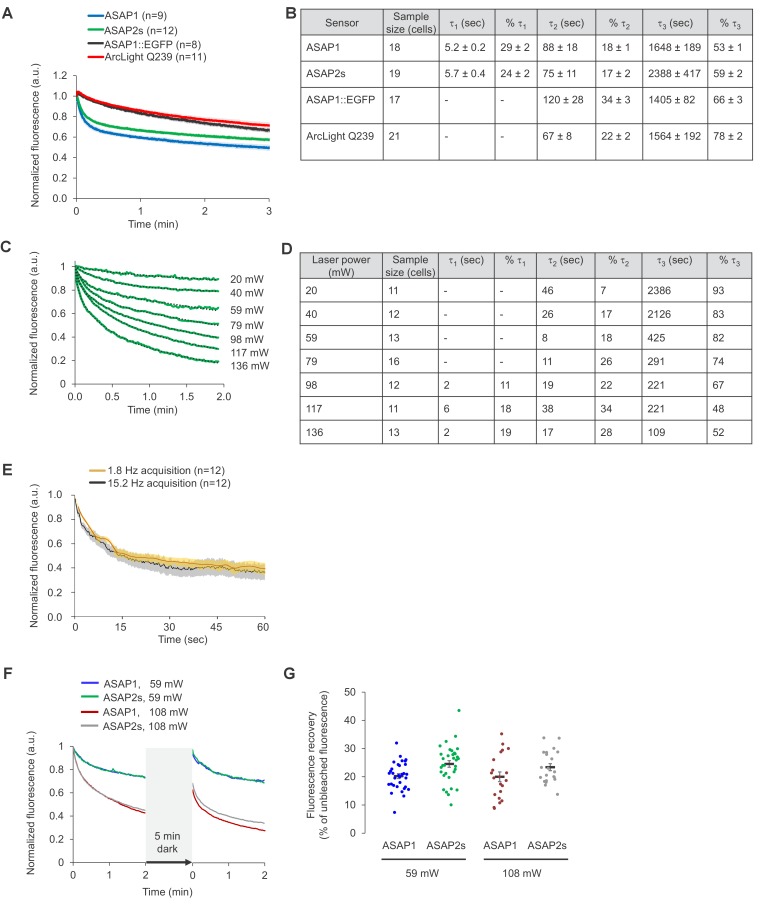
Figure 1—figure supplement 4. Photostability of ASAP sensors in immortalized cells under two-photon illumination.

Figure 1—figure supplement 4.

For all panels, HEK293-Kir2.1 cells transiently expressing the voltage indicators (or the ASAP1::EGFP control) were imaged under two-photon illumination using a femtosecond pulsed Ti:sapphire laser. (A) Two-photon photobleaching kinetics at a power level of 6.4 mW at the objective back aperture, using a 60 × 0.9 NA objective, and an excitation wavelength of 920 nm. Each pixel was sampled at 2.23 Hz with a dwell time of 5.2 μs. Fluorescence was normalized to 1.0 at t = 0 and averaged over all cells (n). Shaded areas correspond to the SEM. (B) Photobleaching time constants for the data in panel A. Values are presented as mean ± 1 SEM. (C) Dependence of photobleaching kinetics on laser power. Cells transiently expressing ASAP2s were imaged with a 20 × 1.0 NA objective and illuminated with the two-photon laser tuned to 900 nm and attenuated to various power levels from 20 to 136 mW. Each pixel was sampled at 1.03 Hz with a dwell time of 1.58 μs. Fluorescence was normalized to 1.0 at t = 0 and averaged over all cells (green traces). Dotted lines correspond to exponential fits. (D) Photobleaching time constants for the data in panel C. (E) Two-photon photobleaching kinetics at 900 nm under two conditions with matched power per pixel. The slow acquisition condition was performed at 1.8 Hz with a 80.2 μs dwell time per pixel and 19.8 mW of power at the sample plane. The fast acquisition condition was performed at 15.2 Hz with a 5.2 μs dwell time per pixel and 36.5 mW of power at the sample plane. Both conditions correspond to 2.9 μW average power per pixel. Cells were imaged using a 20 × 1.0 NA objective. Thick traces are the means; shaded areas correspond to the SEM. The sample size (n) corresponds to individual cells. (F) Cells expressing ASAP1 or ASAP2s were excited using two-photon illumination for 2 min, incubated in the dark for 5 min, and illuminated again for 2 min. Cells were imaged with a 20 x-1.0 NA objective. Frames were acquired at 1.03 Hz and with a 1.58 μs pixel dwell time. The laser was tuned to 900 nm and its power adjusted to 59 or 108 mW at the sample plane, corresponding to 1.0 and 1.8 μW per pixel, respectively. n = 32, 33, 21, and 21 cells for ASAP1s (59 mW), ASAP2s (59 mW), ASAP1 (108 mW), and ASAP2s (108 mW), respectively. (G) Quantification of the fluorescence recovery in panel F. Circles are individual cells, black bars are the means, and error bars are the SEM.