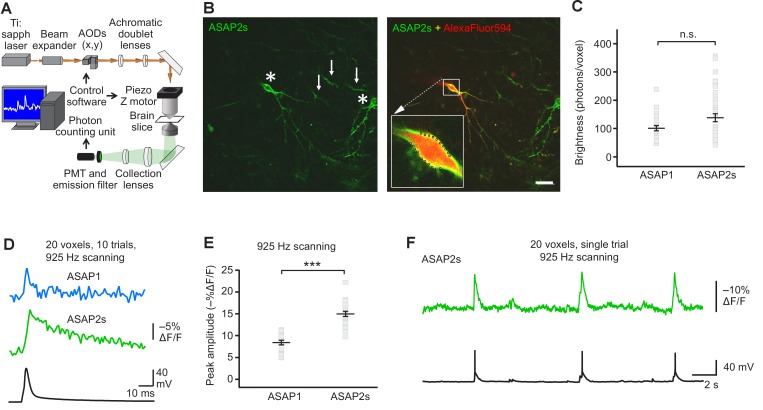
Figure 4. FEVIR: fast random-access two-photon imaging of GEVI responses in organotypic hippocampal slice cultures.
(A) Schematic of our random-access multi-photon (RAMP) imaging system. (B) Representative two-photon single-plane image of ASAP2s-expressing neurons in an organotypic hippocampal slice culture. Left, two neurons can be seen (asterisks), together with processes belonging to ASAP2s-expressing neurons in different planes (arrows). Right, overlay of ASAP2s and AlexaFluor594 fluorescence identifies the neuron recorded in whole-cell configuration. Inset shows how 20 individual voxels (squares) can be selected along the plasma membrane when imaging at 925 Hz. Scale bar, 20 μm. (C) Mean number of photons emitted per voxel during a 50 μs exposure (n = 23 neurons for ASAP1, n = 40 for ASAP2s). Data obtained at a holding potential of –70 mV. Individual neurons are shown as gray squares. Black horizontal bars are the means, and error bars are the SEM (p>0.05, Mann-Whitney U-test). (D) Representative ASAP2s and ASAP1 responses to a single current-evoked AP (black trace). Optical recordings were acquired at 925 Hz with 20 voxels per neuron. Traces are the average of 10 trials. (E) Peak response amplitudes at the soma induced by single current-triggered APs were significantly larger with ASAP2s (n = 17 neurons for ASAP1, n = 23 for ASAP2s, ***p<0.001, t-test). Each data point (gray squares) corresponds to the mean response amplitude to 10 APs per neuron. Black horizontal bars are the means, and error bars are the SEM. (F) Representative single-trial ASAP2s response to spontaneous APs. The voltage trace (bottom) was obtained by simultaneous patch clamping.


