. 2017 Jul 27;6:e25690. doi: 10.7554/eLife.25690

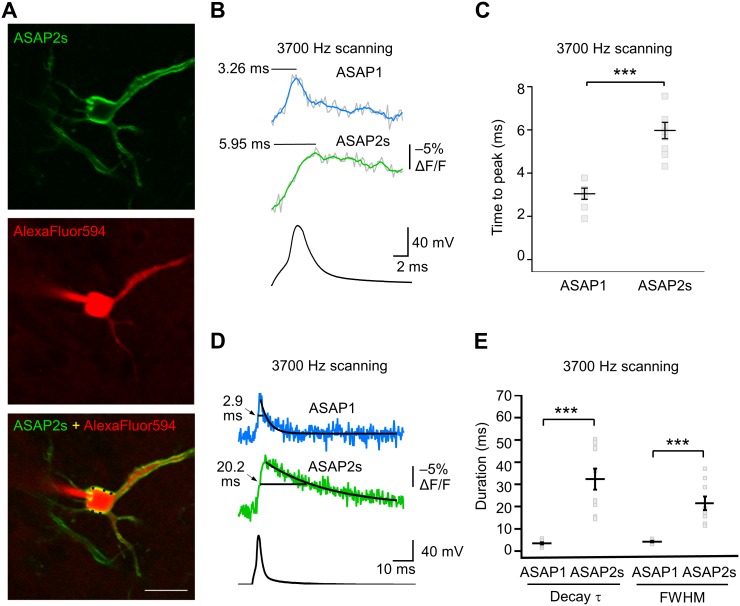
Figure 6. GEVI response kinetics to action potentials in organotypic hippocampal slice culture.

(A) ASAP2s and AlexaFluor594 fluorescence from a representative neuron. Overlay shows the five positions (black squares) selected for imaging at 3700 Hz. Scale bar, 20 μm. (B) Representative ASAP1 and ASAP2s responses to current-triggered APs. The indicated time values correspond to the time of the peak response from the beginning of the AP. Optical recordings were acquired at 3700 Hz with five voxels per neuron. The mean of 10 traces is shown (gray trace) along with a five-point moving average (colored traces). The electrophysiological trace was obtained from the same neuron as the ASAP1 optical trace. (C) Time-to-peak measured with ASAP1 and ASAP2s (n = 9 neurons for ASAP1, n = 7 for ASAP2s). Black horizontal bars are the means, and error bars are the SEM. ***p<0.001 (t-test). (D) Optical spike width (full width at half maximum) of representative ASAP1 and ASAP2s responses to current-triggered APs. The traces are from panel B and shown here over a longer time scale. Decay time constants (τ) were obtained from single-exponential fits. (E) Mean decay time constants (τ) and full width at half maximum (FWHM) of ASAP2s and ASAP1 responses to action potentials. n = 7 neurons for ASAP1, n = 9 for ASAP2, ***p<0.001 (t-test).

DOI: http://dx.doi.org/10.7554/eLife.25690.022

Figure 6.

Figure 6—figure supplement 1. Photostability of ASAP2s imaged by RAMP microscopy.

Figure 6—figure supplement 1.

(A) ASAP2s-expressing cells in an organotypic hippocampal slice culture were illuminated with a Ti:sapphire laser tuned to 900 nm and set to a power level of 25 mW at the sample plane. Each pixel was sampled at 463 Hz with a dwell time of 50 μs. Cells were imaged with a 25 × 0.95 NA objective. Fluorescence was normalized to 1.0 at t = 0 and averaged over all cells. Lighter shading is ±1 SEM. The sample size (n) corresponds to individual neurons. (B) Photobleaching time constants for the data in panel A. Values are presented as mean ± 1 SEM.
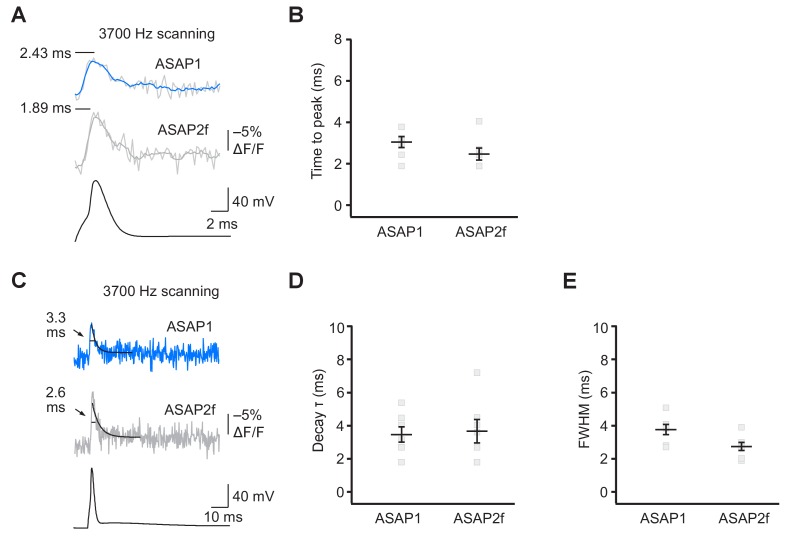
Figure 6—figure supplement 2. ASAP2f and ASAP1 report APs in organotypic hippocampal slice cultures with similar kinetics.

Figure 6—figure supplement 2.

(A) Representative optical responses of ASAP1 and ASAP2f to a single current-evoked AP. The AP voltage trace corresponds to the ASAP2f trace. For each neuron, 10 trials were conducted, each imaging 5 voxels at 3700 Hz. Raw and five point-box smoothed traces are overlaid. The black horizontal bar illustrates the measurement of the time to peak. (B) Time to peak of ASAP1 and ASAP2f. Individual gray squares correspond to single neurons. Black horizontal bars are the means, and error bars are the SEM. (n = 7 neurons per GEVI). (C) The traces from panel A are shown over a longer time scale. Measurements of the full width at half maximum (FWHM) are indicated. Single-exponential fits to fluorescence decay are also shown (black lines). (D,E) Decay time constants (panel D) and FWHM (panel E) of ASAP1 and ASAP2f. Decay time constants (τ) were obtained from single-exponential fits. Gray squares show individual neurons. Black horizontal bars are the means, and error bars are the SEM. n = 7 neurons per GEVI. The ASAP1 data in this figure is also shown in Figure 6.