. 2017 Jul 27;6:e25690. doi: 10.7554/eLife.25690

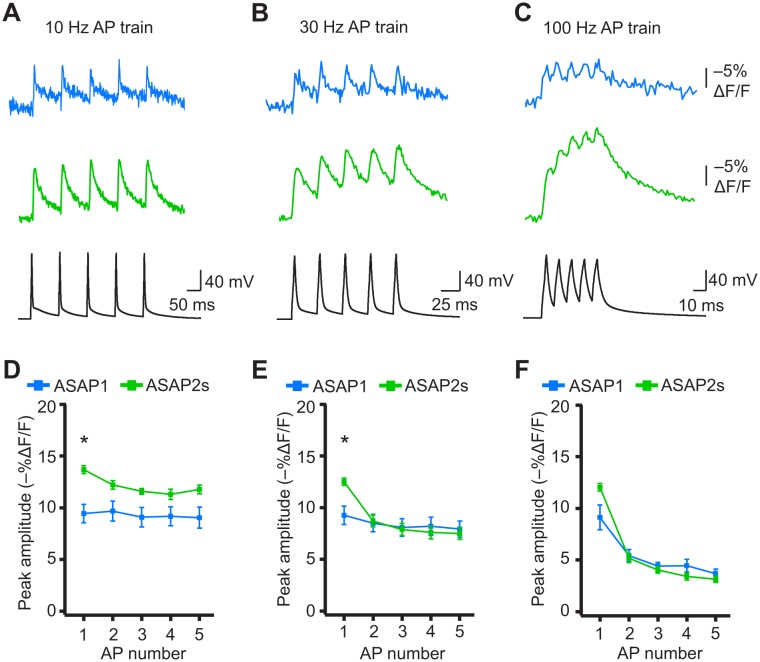
Figure 8. Detecting individual spikes in trains of action potentials.

(A–C) Representative responses to trains of five APs were evoked by current injection at 10 Hz (A), 30 Hz (B), or 100 Hz (C) in organotypic hippocampal slice cultures. Optical recordings were acquired at 925 Hz with 20 voxels per neuron. Traces are the average of 10 trials and were corrected for photobleaching. Blue, ASAP1; green, ASAP2s. (D–F) Peak amplitude of ASAP1 and ASAP2s responses to each spike of a train of five APs evoked at 10 Hz (D), 30 Hz (E), and 100 Hz (F) with n = 7 neurons per GEVI. *p<0.05 (t-test corrected with Holm-Bonferroni method for multiple comparisons). Comparisons are between ASAP1 and ASAP2s. Symbols indicate the mean and error bars show the SEM.

DOI: http://dx.doi.org/10.7554/eLife.25690.028

Figure 8.

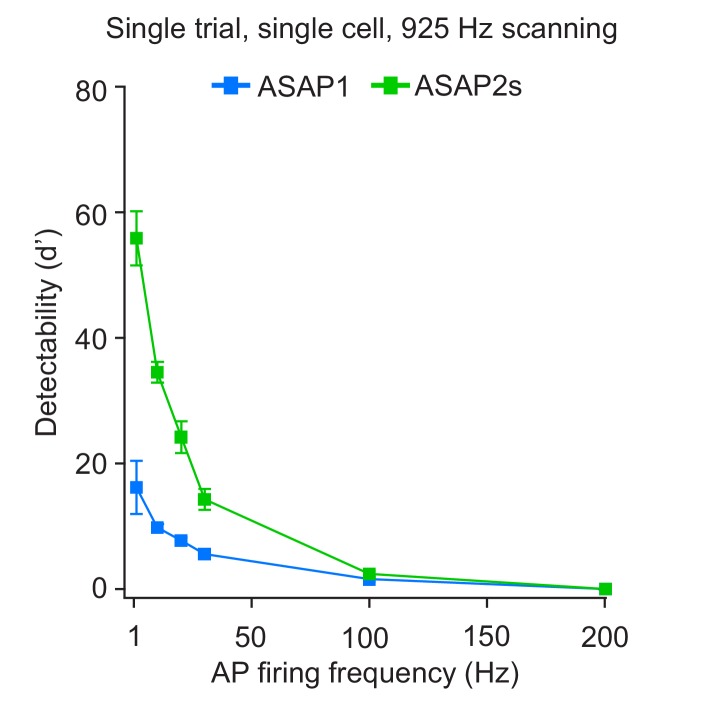
Figure 8—figure supplement 1. Single-trial spike detectability in trains of action potentials.

Figure 8—figure supplement 1.

Trains of current-evoked APs were triggered in bursts of five APs at different frequencies in organotypic hippocampal slice cultures. The 1 Hz condition corresponds to a single AP. GEVI responses were imaged using RAMP microscopy at 925 Hz with 20 voxels per neuron. For each neuron, the detectability metric d’ was calculated using a single trial per train frequency. Since there are five APs per train, the d’ shown here is the average of the d’ values of individual spikes. For ASAP1 and ASAP2s, respectivity, samples sizes are: 1 Hz: n = 15 and 23 neurons; 10 Hz: n = 5 and 9; 20 Hz: n = 10 and 14; 30 Hz: n = 5 and 9; 100 Hz: n = 5 and 9. Symbols show the means and error bars indicate the SEM.
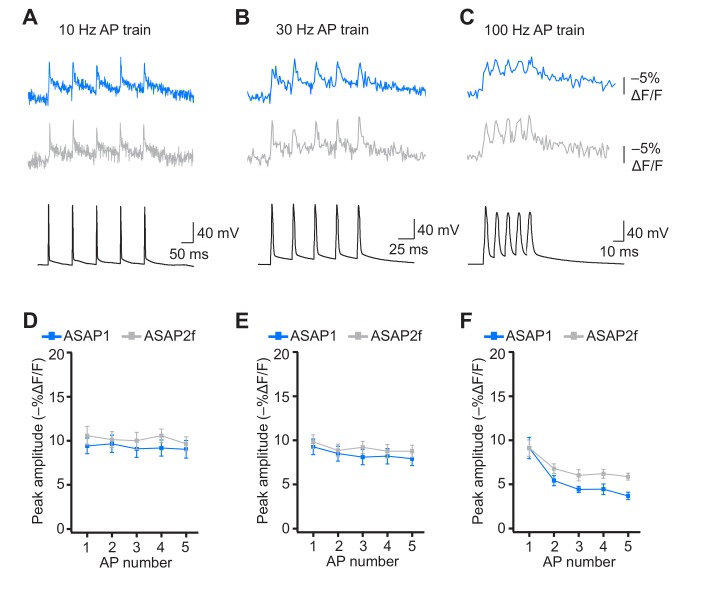
Figure 8—figure supplement 2. Detecting individual spikes in trains of action potentials using ASAP2f.

Figure 8—figure supplement 2.

(A–C) Trains of five APs were evoked by current injection at 10 Hz (A), 30 Hz (B), or 100 Hz (C) in organotypic hippocampal slice cultures. Optical recordings were acquired at 925 Hz with 20 voxels per neuron. Traces are the average of 10 trials and were corrected for photobleaching. Blue, ASAP1; gray, ASAP2f. (D–F) Peak amplitude of ASAP1 and ASAP2f responses to each spike of a train of five APs evoked at 10 Hz (D), 30 Hz (E), or 100 (Hz). n = 7 neurons for ASAP1 and n = 8 for ASAP2f. The ASAP1 data in this figure is also shown in Figure 8. Symbols indicate the mean and error bars show the SEM.