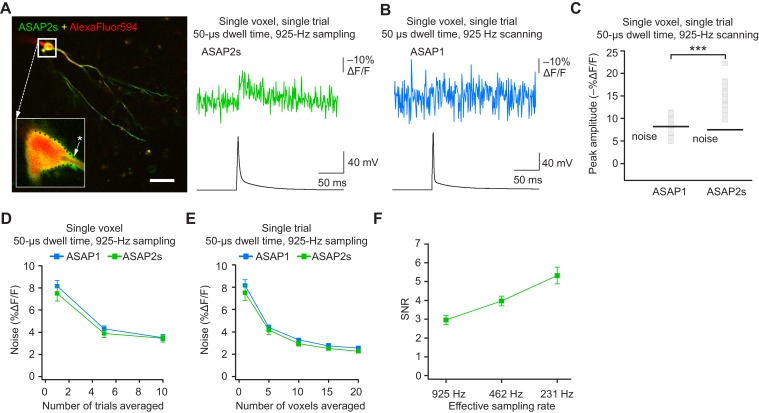
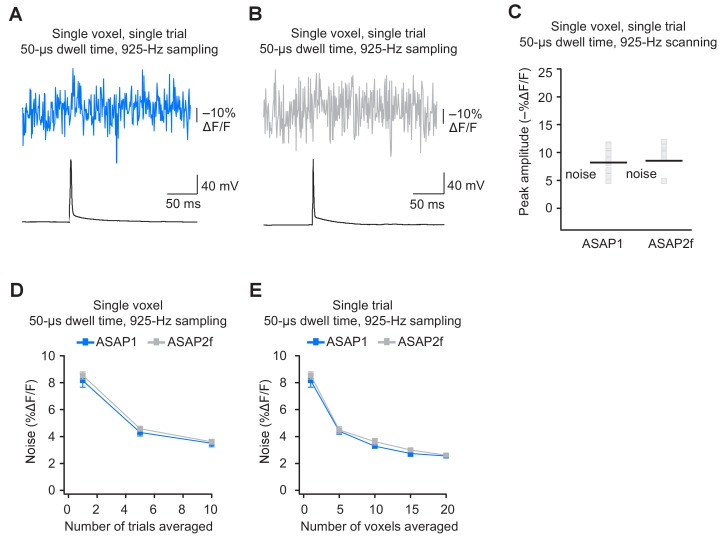
Figure 9. Detecting action potentials in single voxels and single trials.
(A) Left, overlay image of ASAP2s and AlexaFluor594 fluorescence from a representative neuron in an organotypic hippocampal slice culture. The recording site for this example is shown with an asterisk in the inset. Right, example of a single-trial, single-voxel ASAP2s response to a single current-evoked AP. (B) Example of single-trial, single-voxel ASAP1 response to a single current-evoked AP. (C) Single-trial, single-voxel peak amplitude of ASAP1 and ASAP2s responses compared with the noise level. For each neuron, the peak amplitude was independently measured for all 20 imaged voxels; the mean peak response amplitude for each neuron is shown as a gray square. Black bars correspond to the mean noise level over all cells. n = 15 (ASAP1) and 23 (ASAP2s) neurons. ***p<0.001 (t-test). (D) Single-voxel noise as a function of the number of trials averaged. Symbols indicate the mean and error bars show the SEM. No significant difference was observed between ASAP1 and ASAP2s. n = 15 (ASAP1) and 23 (ASAP2s) neurons. p>0.05 (Mann-Whitney U-test with Holm-Bonferroni correction for multiple comparisons). (E) Single-trial noise as a function of the number of voxels averaged. Symbols indicate the mean and error bars show the SEM. No significant difference was observed between ASAP1 and ASAP2s. n = 15 (ASAP1) and 23 (ASAP2s) neurons. p>0.05 (Mann-Whitney U-test with Holm-Bonferroni correction for multiple comparisons). (F) Resampling ASAP2s responses by binning adjacent timepoints increases the SNR for single-trial single-voxel AP detection. Original timepoints were sampled at 925 Hz with dwell times of 50 μs. Only one voxel was analyzed per neuron, resulting in a slight difference in mean SNR compared with the value derived from the data in panel C and reported in the main text. n = 15 (ASAP1) and 23 (ASAP2s) neurons. For panels D-F, symbols indicate the mean and error bars show the SEM.


