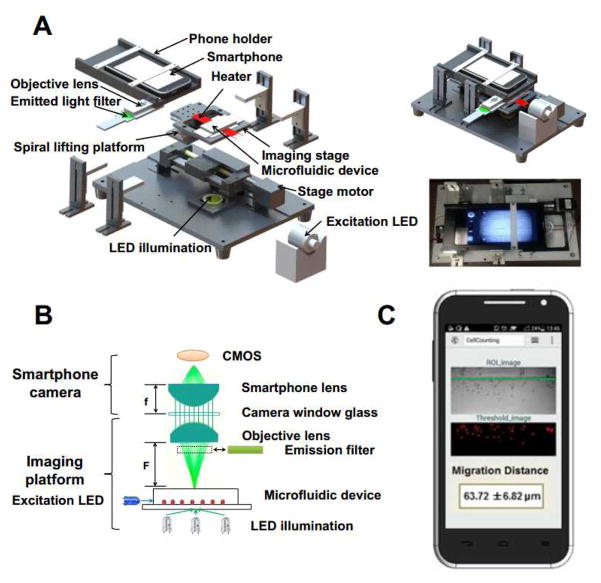
Fig. 2. Illustration of the smartphone imaging platform.
(A) Expanded view of the imaging platform. The system is 260 (L) × 180 (W) × 100 (H) mm; The illustration and a picture of the real assembled imaging platform are shown on the right; (B) Optical configuration of the imaging platform; (C) Smartphone app interface showing the cell migration distance analysis. The green line denotes the edge of the gradient channel next to the docking structure. The final result is presented as the average migration distance of all cells ± standard error of the mean (s.e.m.) in μm.

