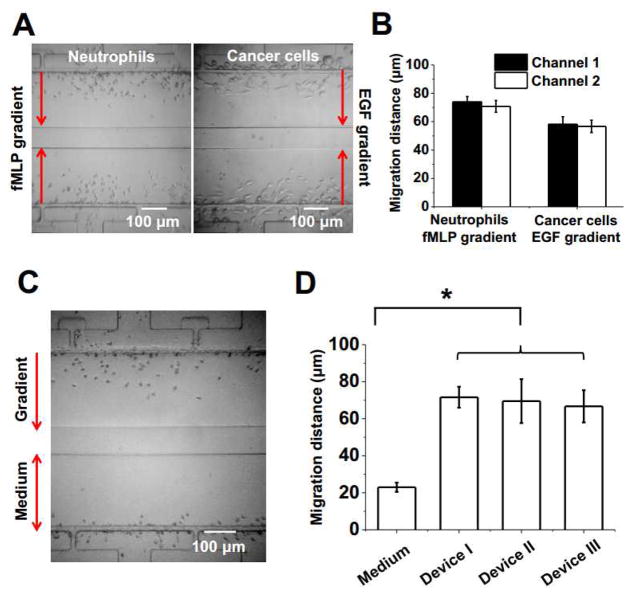
Fig. 5. Chemotaxis test of neutrophils and cancer cells using the Mkit.
(A) Final distribution of purified neutrophils and cancer cells in the gradient channels in response to a 100 nM fMLP gradient or a 30 nM EGF gradient respectively. The experiment was done in duplicate on each device for purified neutrophils or cancer cells. (B) Cell migration distance analysis of chemotaxis experiments using purified neutrophil and cancer cells. (C) Final distribution of neutrophils from whole blood to a 100 nM fMLP gradient or in the medium control; (D) Cell migration distance analysis of neutrophil from whole blood in 3 different devices. The bars show the average migration distance of all cells to the fMLP gradient for each device and the error bars are the standard error of the mean (s.e.m.). The migration distance of the medium control shown in the graph is the average of all cells from one device and it is similar in all three devices.

