Figure 4.

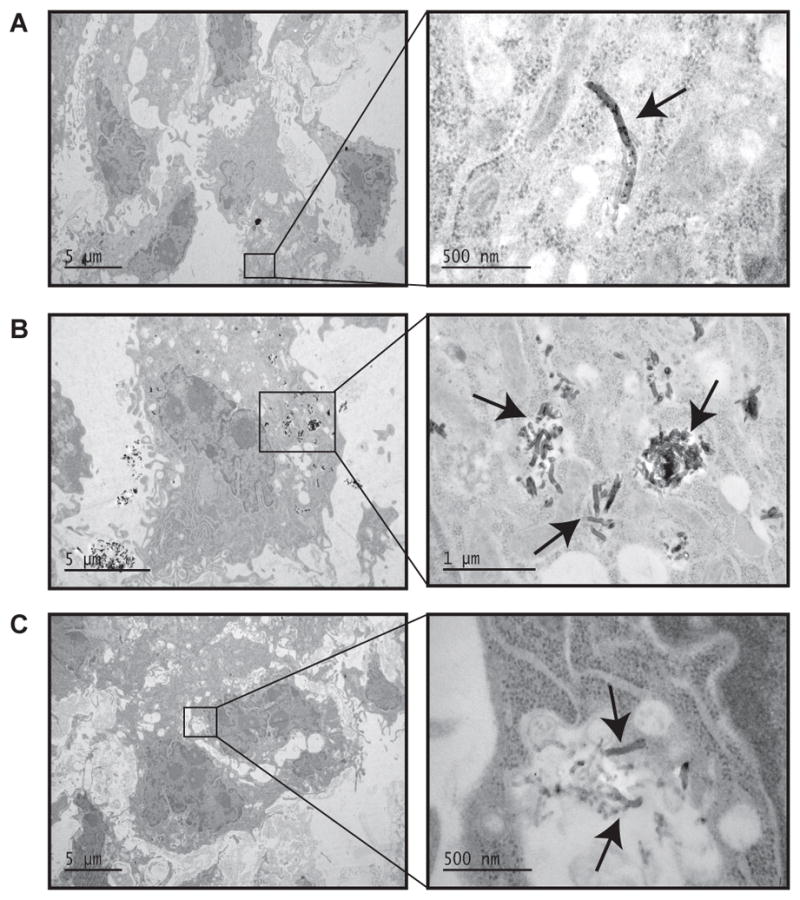
TEM images of E10 cell exposure. (A) 5 μg/mL U-MWCNT exposure, (B) 5 μg/mL A-MWCNT, and (C) 1 μg/mL Z-MWCNT. Arrows indicate MWCNTs within the cytoplasm of E10 cells.

TEM images of E10 cell exposure. (A) 5 μg/mL U-MWCNT exposure, (B) 5 μg/mL A-MWCNT, and (C) 1 μg/mL Z-MWCNT. Arrows indicate MWCNTs within the cytoplasm of E10 cells.