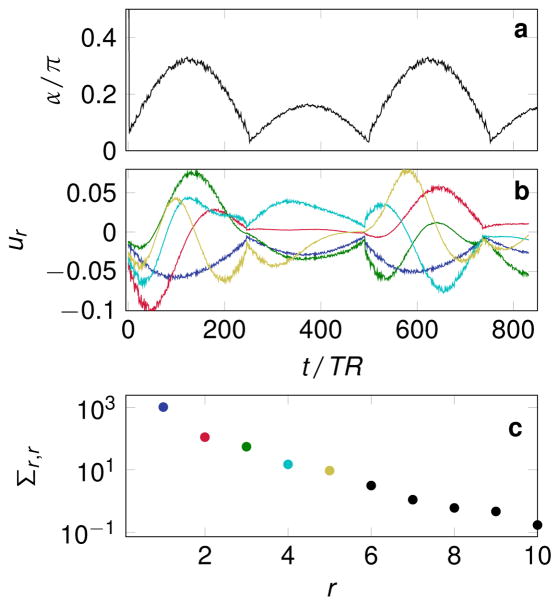
Figure 1.
The flip angle pattern is depicted in (a), while (b) shows the first five left singular vectors (columns of u), which result from the singular value decomposition of the dictionary and were used for the low rank approximation unless stated otherwise. Their color-coding corresponds to (c), where the first ten singular values of the dictionary are shown.

