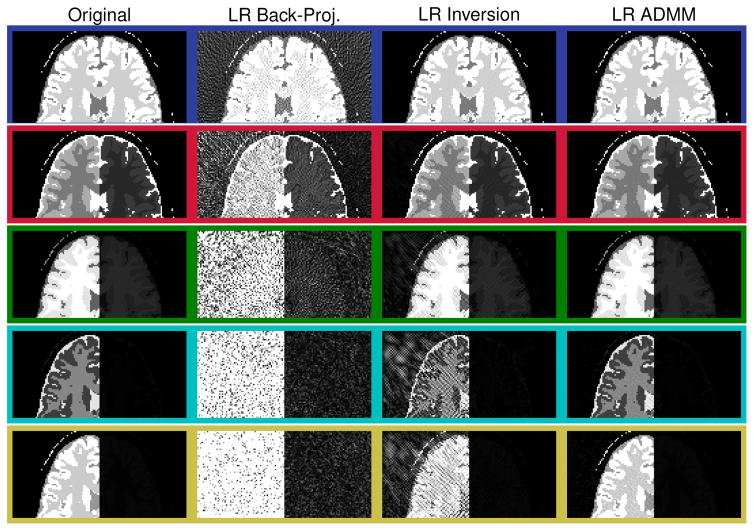
Figure 4.
The series of images x̃ reconstructed from noise free synthetic data are shown. The rows correspond to the singular values in decreasing order and their color coding corresponds to Fig. 1(b, c). The columns show the different low rank (LR) reconstruction techniques discussed in this paper. Only the top half of the images are shown for better depiction. The right hand side of all images are scaled equally, while the left hand side is scaled equally only within the same row.

