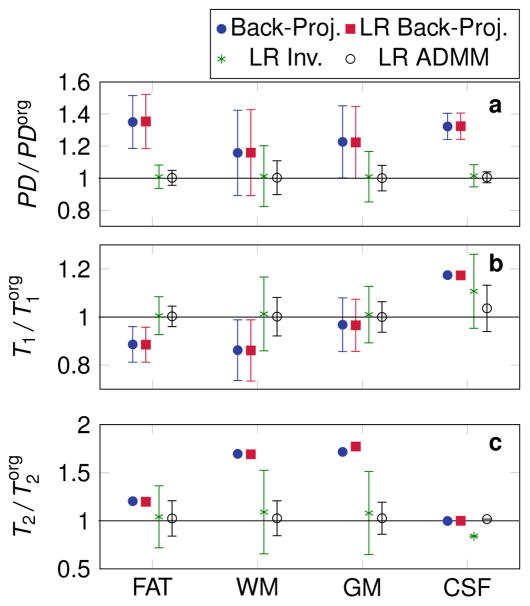
Figure 6.
The mean value and the standard deviation (error bars) within fat, white matter (WM), gray matter (GM) and cerebrospinal fluid (CSF) are shown. The values are normalized by the original parameters used in the simulation. All low rank (LR) reconstructions were performed with R = 5. Error bars are not displayed for those cases, where strong deviations from a Gaussian distribution make the calculation of the standard deviation questionable.

