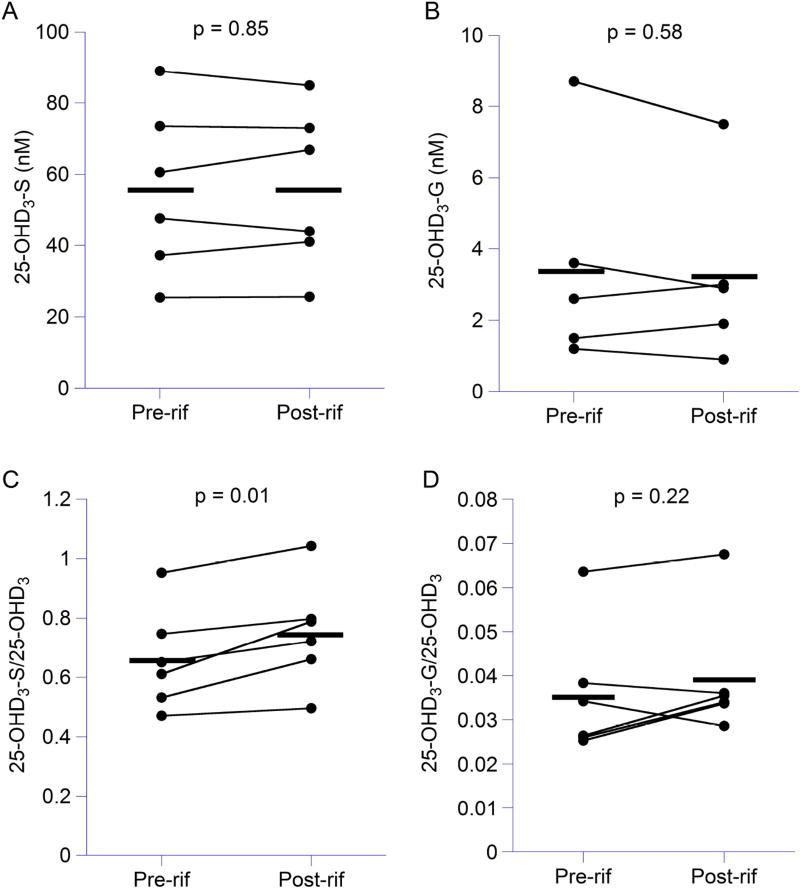
Figure 4. Serum concentrations of 25-OHD3-3-sulfate and 25-OHD3-3-glucuronide following rifampin treatment.
Serum concentrations of 25-OHD3-3-sulfate (A) and 25-OHD3-3-glucuronide (B) and ratios of 25-OHD3-3-sulfate/25-OHD3 (C) and 25-OHD3-3-glucuronide/25-OHD3 (D) in healthy volunteers (n = 6) before and after rifampin treatment were compared by a paired Student’s t-test. A p-value < 0.05 was considered significant. Each individual is represented by a dot and the bar represents the means of each group.

