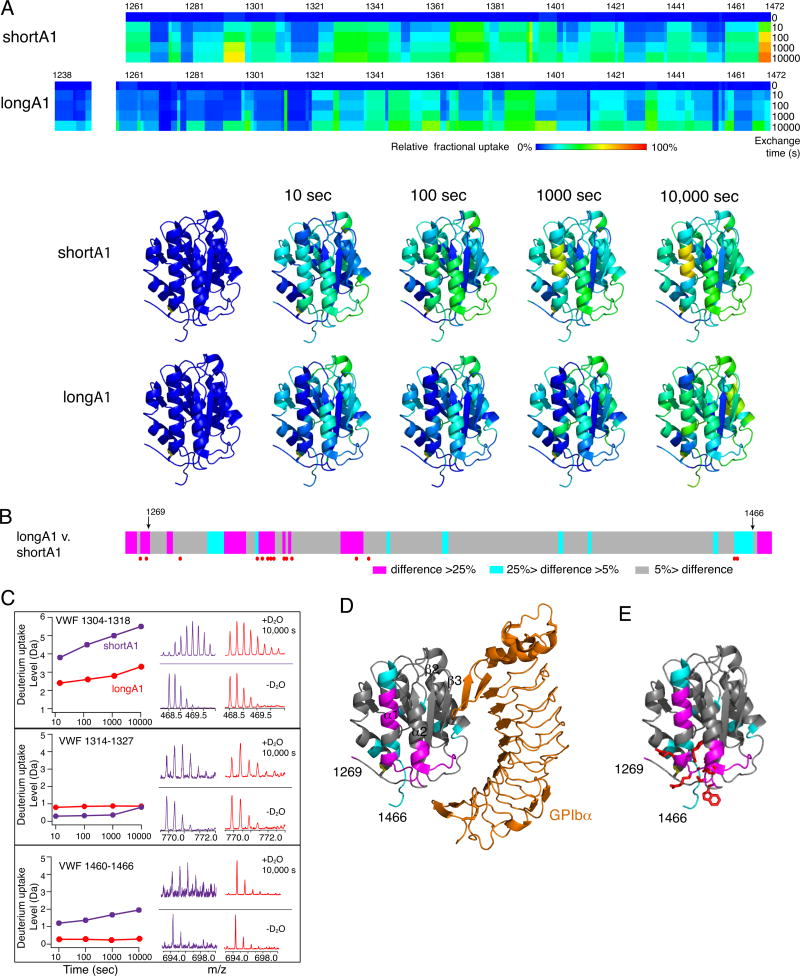
Figure 2. Difference in HDX between shortA1 and longA1.
Comparison of HDX between shortA1 and longA1. (A) Residual HDX heat maps of shortA1 and longA1 for the noted exchange time. The line for 0 sec denotes the results obtained without exchange. Relative fractional deuterium uptake was calculated for each residue amide from the measured deuterium uptakes of peptic fragments as described in Materials and Methods, and plotted using the rainbow color scale in the figure. Residues 1251–1257 were not detected and are left blank. HDX data of shortA1 and longA1 at the indicated exchange time are mapped to the structure of A1 domain (PDB: 1SQ0; only residues 1269–1466 are shown in the structure). The ribbon diagram of the complex structure is generated using PyMOL. (B) The difference in relative fractional uptake between the same residues of longA1 and shortA1 after 10,000 s of exchange, as defined by the color code in the figure. Residues with reported type 2B VWD mutations [13] are marked by red dots. Residues 1269 and 1466, starting and ending residues of the structure of A1, respectively, are marked by arrows. (C) Representative plots of HDX and mass spectra of three peptic fragments from shortA1 and longA1. Each peptide is identified by the starting and ending residue numbers of VWF. (D) The difference in HDX mapped to a structure of A1 in complex with the ligand-binding domain of GPIbα. Certain secondary structure elements in A1 are labeled. (E) The HDX-protected region in the A1 domain (residues 1269–1466) is clustered with type 2B VWD mutations. Each mutation site is illustrated by its side chain shown in red sticks.

