Figure 2.

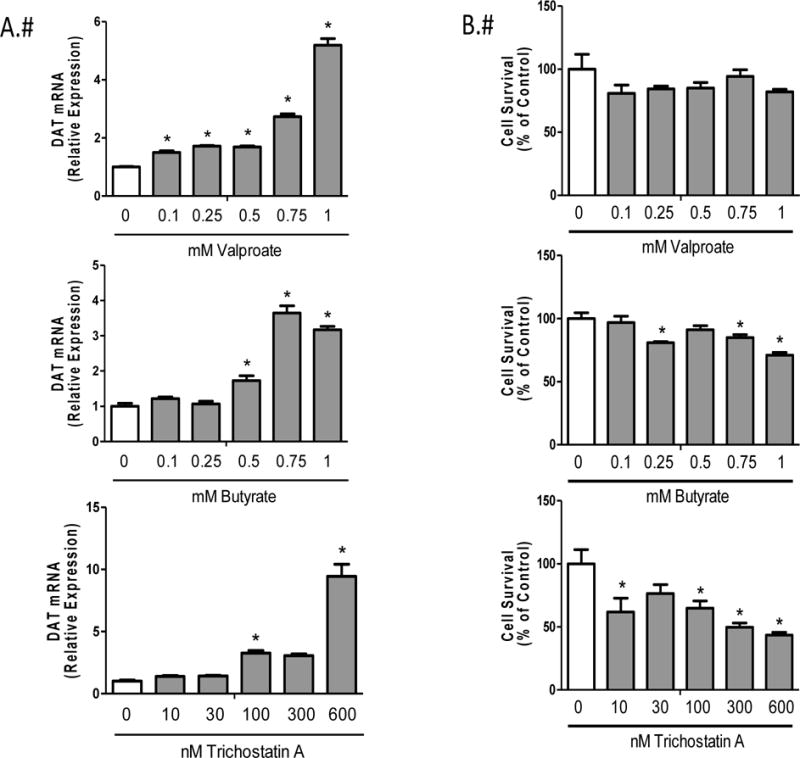
HDAC inhibitor dose response in N27 rat mesencephalic cells A) Relative DAT mRNA expression and B) Cell Viability for valproate, butyrate and Trichostatin A. Data represent mean ± SEM; N=3–4, *p≤0.05 (One-way ANOVA, Dunnet’s post hoc).

HDAC inhibitor dose response in N27 rat mesencephalic cells A) Relative DAT mRNA expression and B) Cell Viability for valproate, butyrate and Trichostatin A. Data represent mean ± SEM; N=3–4, *p≤0.05 (One-way ANOVA, Dunnet’s post hoc).