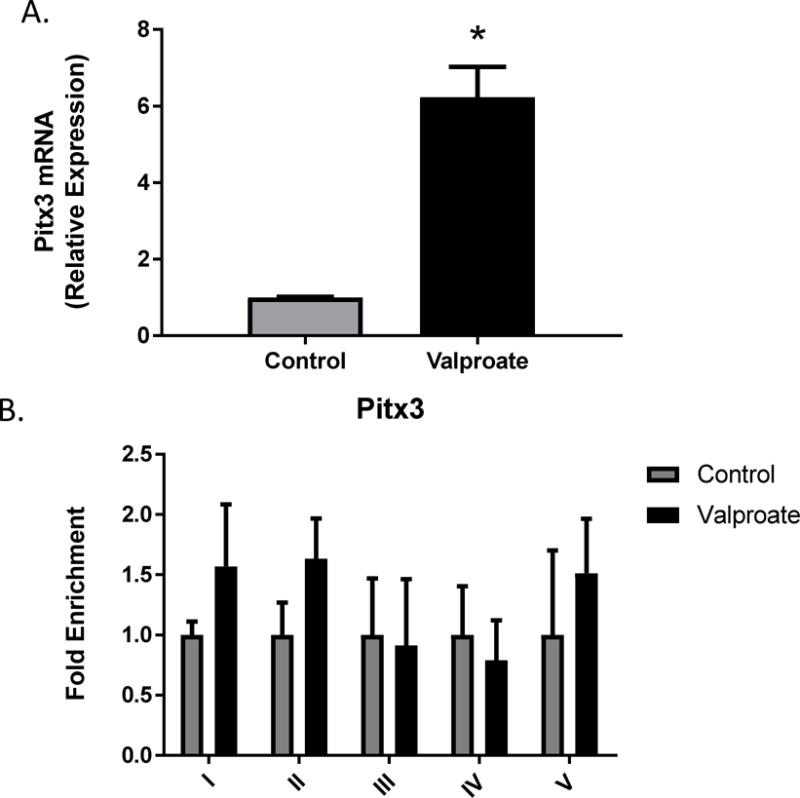
Figure 6.

Pitx3 A) mRNA expression and B) fold enrichment in the DAT promoter binding following 1mM valproate treatment in N27 cells. Data represented as mean ± SEM; N=3–4, *p≤0.05 (t-test). For mRNA expression, data were first normalized to β-actin, then normalized to the control treatment group. For ChIP assay, data were normalized to input, IgG and represented as enrichment relative to control.
