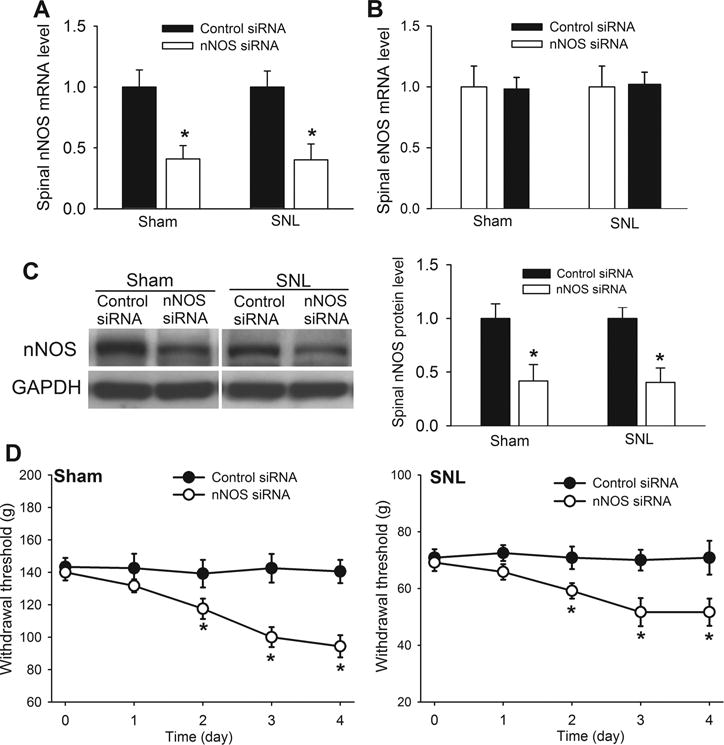
Figure 4. Tonic nociceptive inhibition by nNOS at the spinal cord level in sham and SNL rats.

(A,B) Mean effects of intrathecal treatment with nNOS-specific siRNA (4 :g/day for 4 days) on the mRNA level of nNOS and eNOS in the dorsal spinal cord of sham control rats and SNL rats (n = 8 rats in each group). Data are presented as means ∀ s.e.m. *P < 0.05 (versus control siRNA-treated rats). Two-tailed Student’s t-test. (C) Western blot analysis and quantification of the nNOS protein level (~160 kDa) in the dorsal spinal cord of sham control rats and SNL rats (n = 6 rats in each group). GAPDH was used as a loading control. Data are means ∀ s.e.m. *P < 0.05 (versus control siRNA-treated rats). Two-tailed Student’s t-test. (D) Time course of the effects of intrathecal treatment with control siRNA or nNOS-specific siRNA (4 :g/day for 4 days) on the mechanical nociceptive withdrawal thresholds of sham and SNL rats (n = 8 rats in each group). Data are means ∀ s.e.m. *P < 0.05 (versus baseline at time 0). One-way ANOVA analysis followed by Dunnett’s post hoc test.
