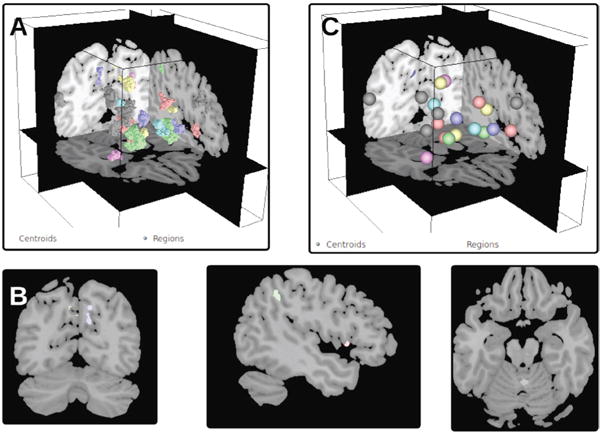
Fig. 4.

Results of community detection with respect to anatomy. Each community is represented by a distinct color, and each region is colored according to its community membership. Parcellated brain regions can be shown as outlines in Fig. 4A or centroid depiction via a sphere Fig. 4C.
