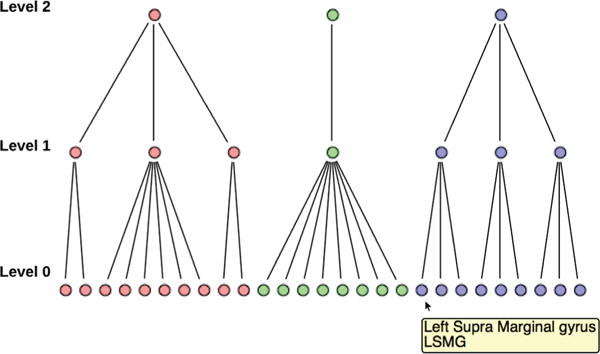
Fig. 6.

The Dendrogram view showing the hierarchical modular information of a community corresponding to threshold value 3.309. Level 1 of the dendrogram represents sub-communities formed when optimizing modularity locally with the nodes in level 0; level 2 nodes represent the final community emerging from the sub-communities identified in level 1.
