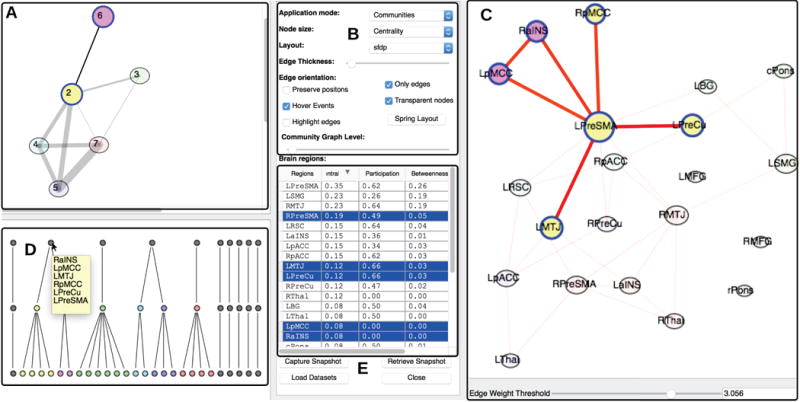
Fig. 7.

A) The community graph highlights the subcommunities associated with the community selected in the dendrogram view. B) Configuration options provide various choices for interactivity, such as toggling hovering/clicking, choosing graph layout and varying the opacity of highlighted nodes. C) The brain region graph displays highlighted nodes associated with selected sub communities. D) (While the dataset is same as Fig. 1F, the threshold value for this visualization view is different)
The dendrogram view displays the hierarchy of communities. The communities that do that not have any edges emanating from them are grayed out. E) A table view lists important graph properties of the graph shown in Fig. 7C.
