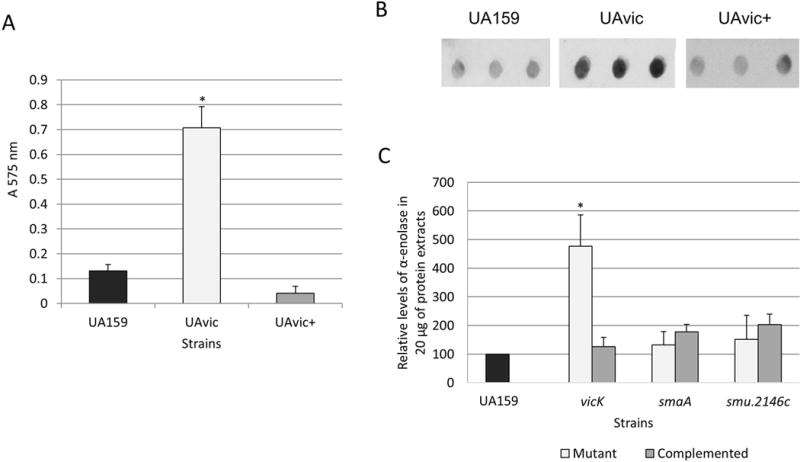
Fig. 4.

Comparisons of binding to human plasma fibronectin and production of α-enolase between UAvic and parent or complemented strains. A) Fibronectin binding was expressed as the absorbance of crystal violet stain (A575nm) eluted from bacteria bound to immobilized fibronectin. B) Levels of α-enolase produced by strains were measured in whole cell extracts using immuno dot blot assays with polyclonal antibody anti-S. pyogenes α-enolase. C) Densitometric measures of immuno reactions were expressed as the relative levels of α-enolase in relation to parent strain (set as 100%). Columns represent means of three independent experiments; bars represent standard deviations. Asterisks indicate significant differences in relation to parent strain (Kruskal-Wallis with post hoc Dunn’s test; p< 0.05).
