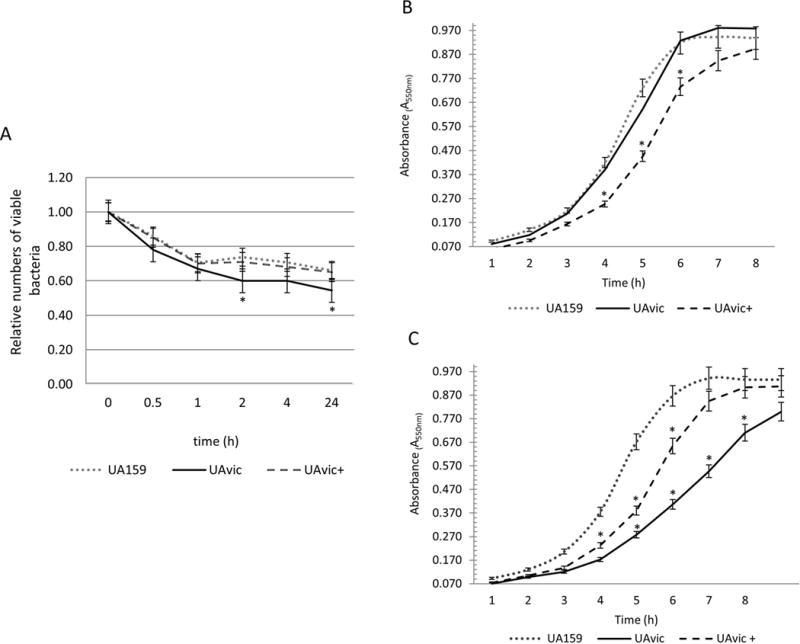
Fig. 5.

Comparisons of ex vivo survival in human blood and growth at different nutritional conditions. A) Numbers of viable bacteria (log cfu/ml) were expressed in relation to initial counts in blood suspension (time 0). Growth curves in BHI (B) and in poor nutrient RPMI (C). Dots represent means of triplicate of one representative experiment. Bars indicate standard deviations. Differences in relation to parent strain at each time-point were tested using Kruskal-Wallis with post hoc Dunn’s test with correction for repeated measures (*p<0.05).
