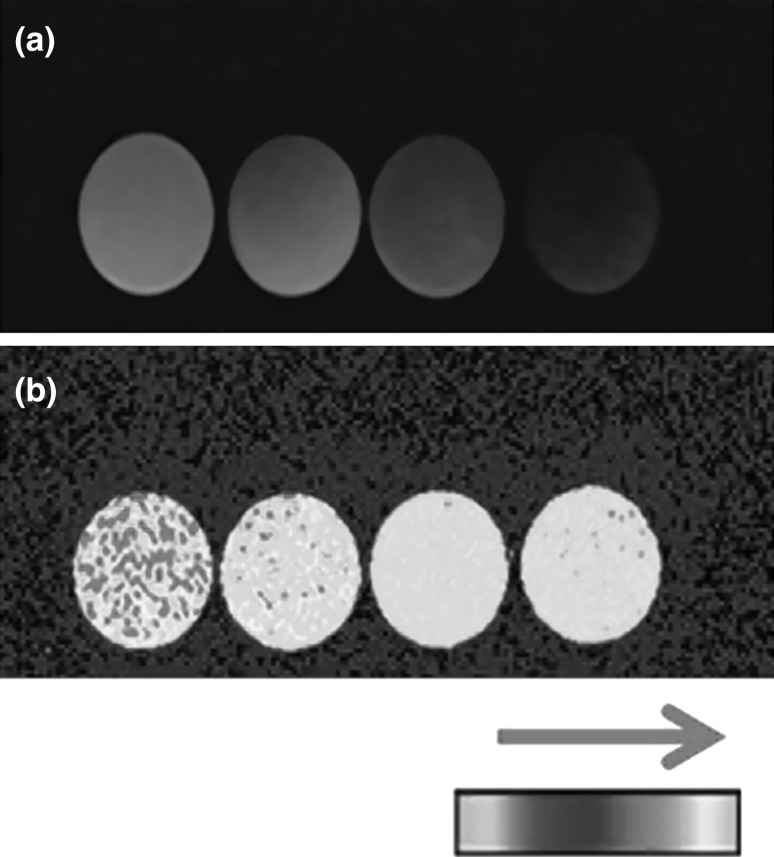
Fig. 1.
T1 signal of the water content in gelatine samples. Using T1-MR sequences, color heat maps of water content were obtained. a Absolute T1-value maps in gelatine samples with different water concentrations (from left to right: 100, 91, 80, 70 %). b The same samples in the inverse recuperation sequence are shown. The arrow above the colorimetric scale indicates increasing water content along the scale

