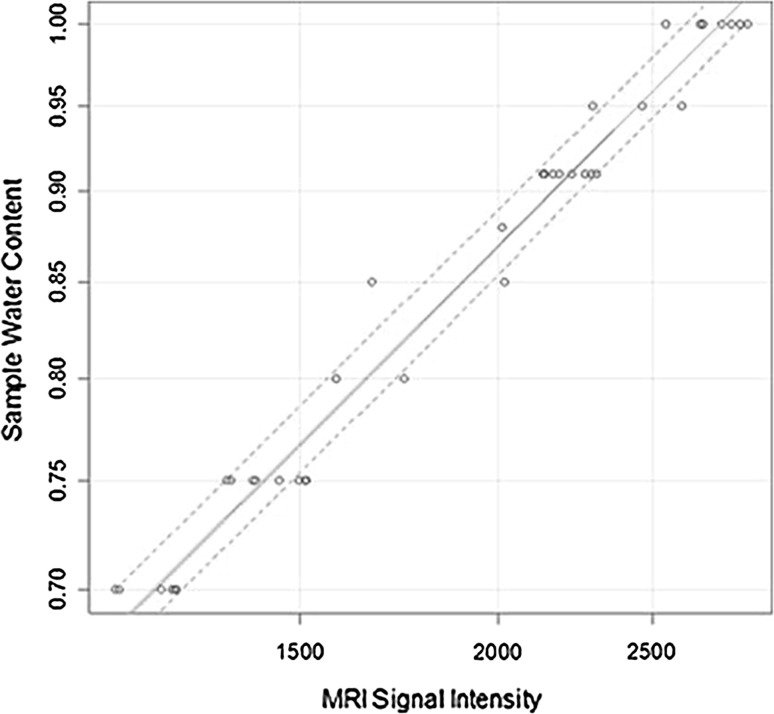
Fig. 2.
Statistical model for the development of the water content prediction equation. T1 values were plotted against the corresponding known water content values. The continuous red line represents the line of best fit, the continuous green line shows the bootstrap validation. Dotted lines represent 95 % confidence intervals (color figure online)

