
Fig. 1.
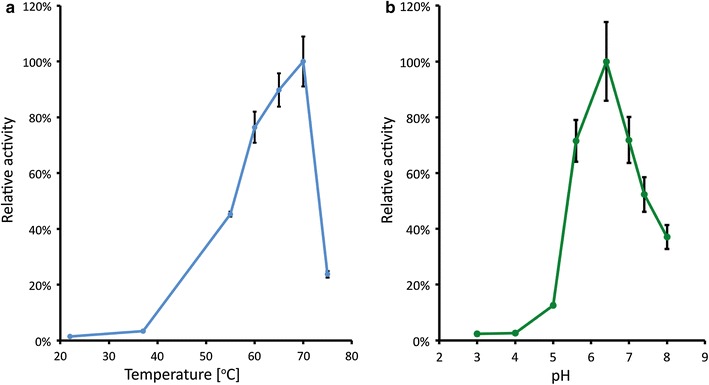
Temperature (a) and pH (b) profiles of the BgaB expressed in E. coli. The Y-axis designates the relative β-galactosidase activity at different conditions temperature (a) and pH (b). Error bars indicate standard deviation calculated based on triplicate experiments. pH profile was assessed at 70 °C