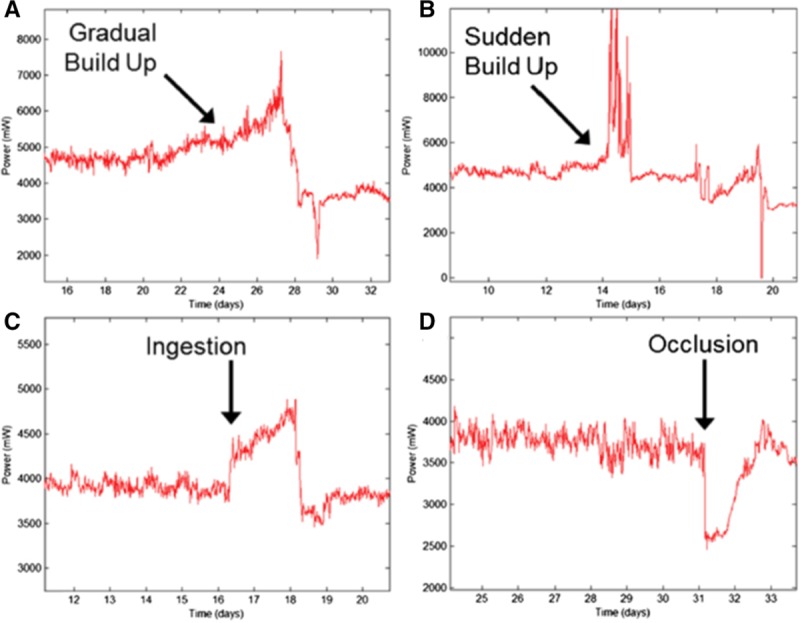
Figure 15.

These Heartware continuous-flow ventricular assist device log file tracings from Jorde et al.14 show examples of how power consumption changes over time with different time courses of pump thrombus formation (A, B, and C) and with an occlusion of the inflow cannula or outflow graft. See reference 14 for details. Reproduced with permission from Elsevier.
