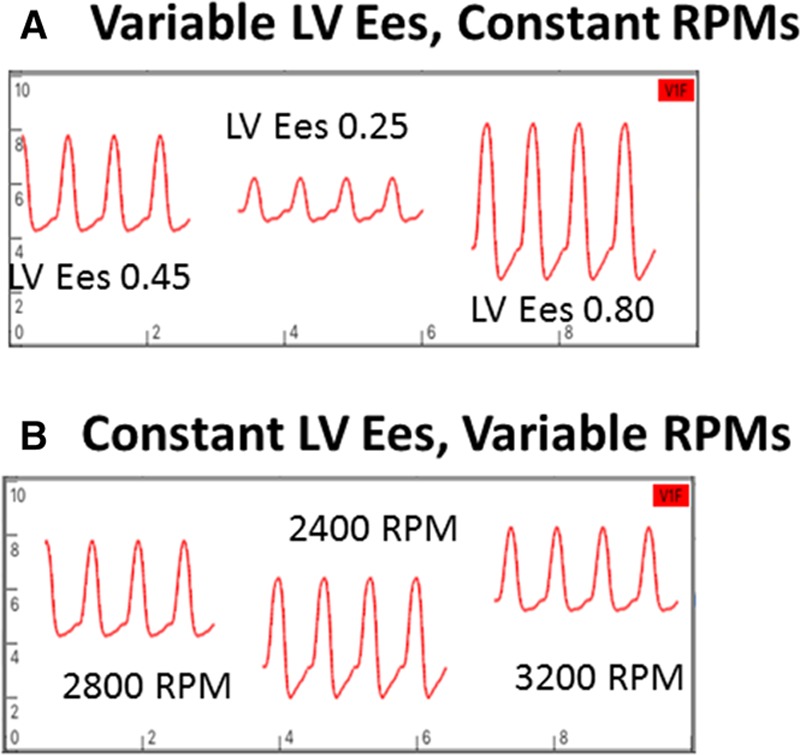
Figure 9.

A: Changes in waveforms with changes in LV contractility at a constant RPM. A decrease in contractility results in a decrease in waveform peak and mean values, an increase in trough, and a decrease in pulsatility. The opposite occurs with an increase in contractility. B: Changes in waveform with changes in RPMs from a baseline value of 2800 RPMs with constant LV contractility. With RPMs decreased to 2400, peak, trough, and mean flows decreased and pulsatility increased. The opposite occurs when RPMs are increased to 3200. Waveforms derived from a cardiovascular simulation (6,7). LV, left ventricle; RPM, revolutions per minute.
