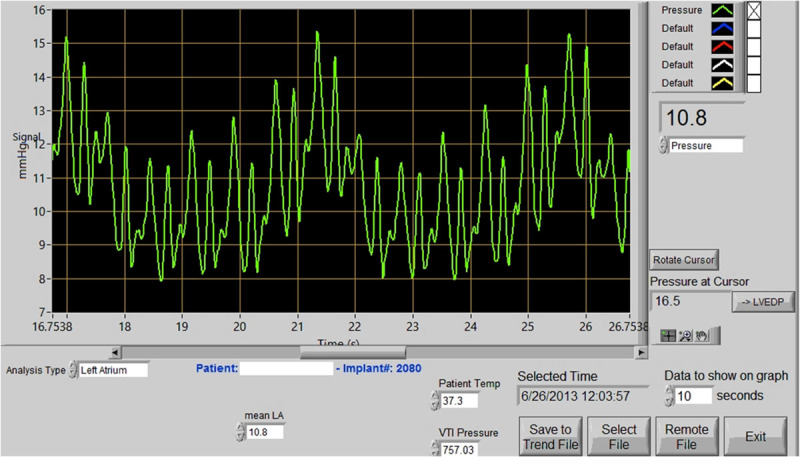
Figure 2.

Titan system monitor screen showing a left atrial pressure curve and mean pressure value (right panel). The data are stored on a computer and sent through the Internet to a central server. In the left panel is an example of plot showing the daily trend of LAP measurements taken at home by the patient.
