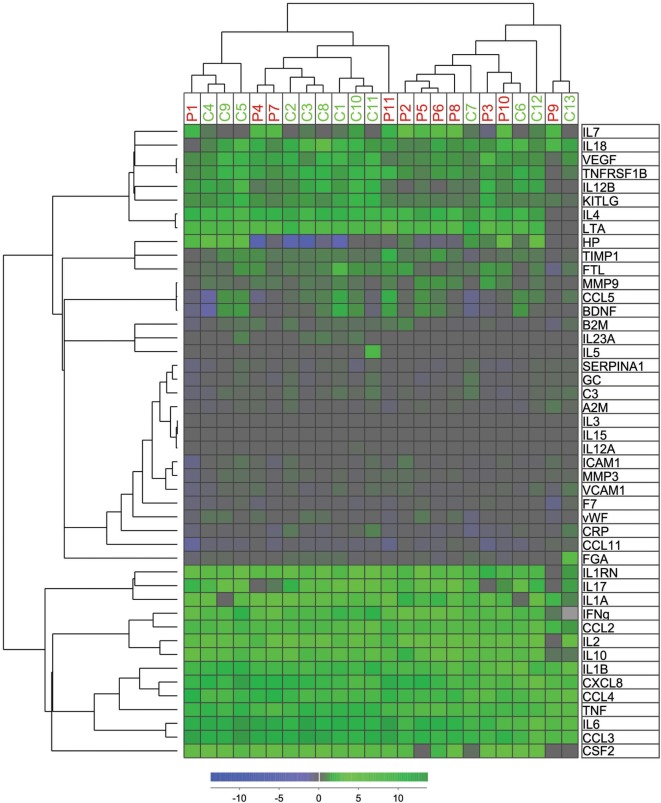
Figure 2.
Hierarchical cluster analyses of mediator alteration in control and patients. Unsupervised hierarchical cluster analyses and distance matrix analyses for 11 patients (red P1–P11) and 13 controls (green C1–C13) were performed. Concentrations of mediators were measured before and after intervention as previously described. The alterations were standardized after ratio after/before intervention and log(2) transformed before unsupervised hierarchical clustering with Squared Euclidean distance measure with weighted average linkage was performed, resulting in a heat map for visualization and interpretation. The mediator alteration profiles identified to main patients/control clusters and two main cytokine clusters.

