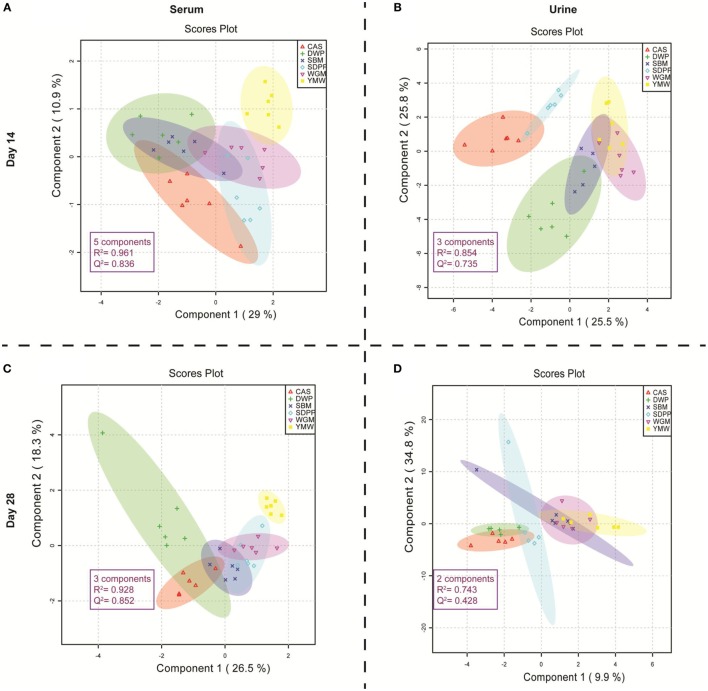
Figure 1.
Partial least square discriminant analysis (PLS-DA) score plots of amine profiles in serum and urine on days 14 and 28 of mice receiving diets with different protein sources. (A) PLS-DA model built using serum amine metabolites of mice at day 14 of the experimental period; (B) PLS-DA model built using urine amine metabolites of mice at day 14 of the experimental period; (C) PLS-DA model built using serum amine metabolites of mice at day 28 of the experimental period; (D) PLS-DA model built using urine amine metabolites of mice at day 28 of the experimental period. The colored dots represent samples from different treatments. Colored spherical areas display 95% confidence region of respective experimental diets. Each symbol represents data from one mouse. Parameters within the magenta box represent the summary from cross-validation of PLS-DA model. The “components” describe the best number of components the model utilizes to capture the discrimination within treatment group based on the highest Q2 value in the cross-validation of PLS-DA model. R2 represents the quality and Q2 represents the predictability of each PLS-DA model. SBM, soybean meal; CAS, casein; DWP, partially delactosed whey powder; SDPP, spray-dried plasma protein; WGM, wheat gluten meal; YMW, yellow mealworm.

