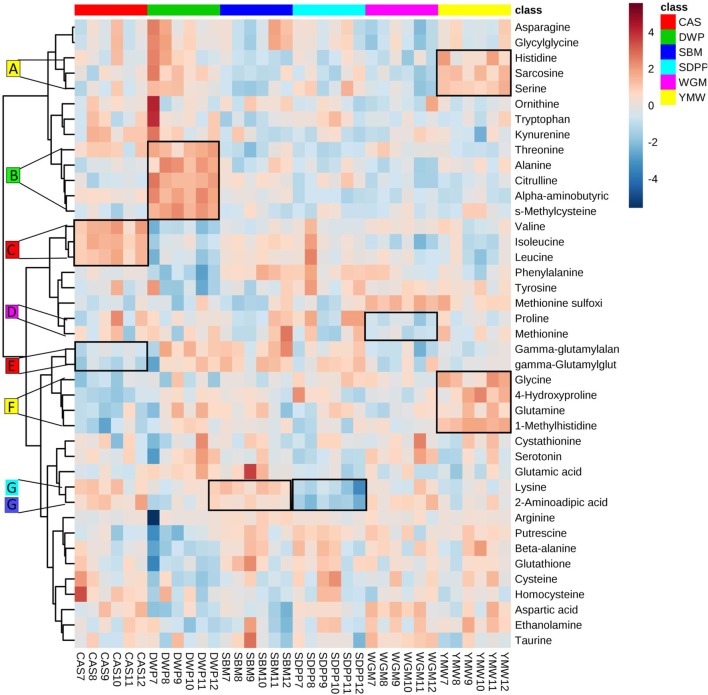
Figure 3.
Heatmap of clustering of serum amine metabolites in dependence of dietary treatment. Values are the relative response ratios of each metabolite in individual mice per treatment group. Treatment groups comprise six mice. Values are measured in serum of mice at day 28 of the experimental period. The heatmap graphic distances were measured using Euclidean distances and the clustering algorithm using ward dendrogram. Each colored cell on the map corresponds to a concentration value (normalized to the SBM treatment). The alphabets A–G represent the diet-associated cluster formed by sets of metabolites (framed in black) having low (shades of blue) or high (shades of orange) concentration in the dietary treatments. Here, the colored square corresponds to the respective experimental diets; i.e., red for CAS, green for DWP, navy blue for SBM, sky blue for SDPP, magenta for WGM, and yellow for YMW. SBM, soybean meal; CAS, casein; DWP, partially delactosed whey powder; SDPP, spray-dried plasma protein; WGM, wheat gluten meal; YMW, yellow mealworm. The alphabets A–G indicate amine metabolite clusters referred to in the text.

