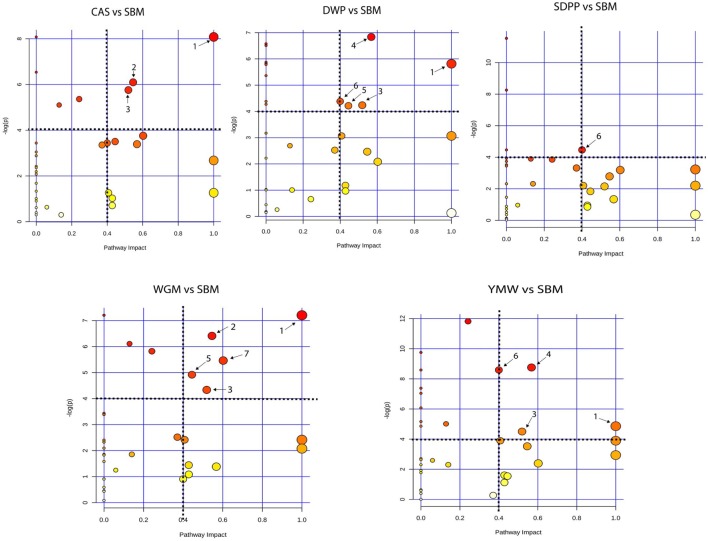
Figure 4.
Metabolic pathway analysis based on the plasma amine profiles in mice fed diets with different protein sources. Bubble graph representing the result of metabolic pathway analysis. Scores from enrichment analysis is represented on the “y-axis” and from topology analysis on the “x-axis.” The size and the color (on gradient scale: white to red) of the nodes are all matched pathways according to P values from pathway enrichment analysis and pathway impact values from pathway topology analysis. The dotted black lines denote the thresholds in both axes to identify the most significant matched pathways for all the dietary comparisons. The arrow indicates to the enriched pathways, where, 1—valine, leucine, and isoleucine biosynthesis; 2—arginine and proline metabolism; 3—glutathione metabolism; 4—glycine, serine, and threonine metabolism; 5—beta-alanine metabolism; 6—methane metabolism, and 7—alanine, aspartate, and glutamate metabolism. SBM, soybean meal; CAS, casein; DWP, partially delactosed whey powder; SDPP, spray-dried plasma protein; WGM, wheat gluten meal; YMW, yellow mealworm.

