Figure 2.
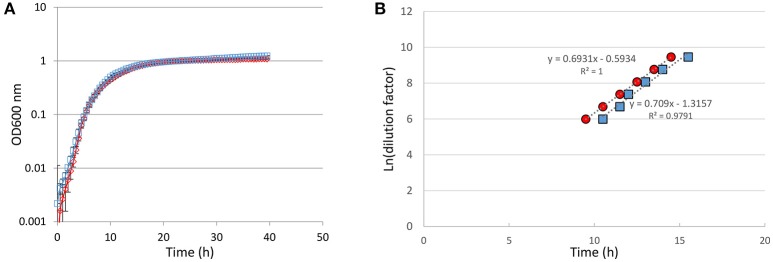
Growth comparison between P. luminescens overexpressing dam gene (red) and control harboring an empty plasmid (blue). (A) Growth curves in LB of the P. luminescens Dam-overexpressing strain and control strain (inoculated at 1.61 × 10⁵ and 1.86 × 10⁵ CFU/ml, respectively). Mean values ± SDs of at least 3 independent biological replicates for each strain are shown. (B) Two-fold serial dilutions of cultures containing 1.25 × 10⁴ CFU/ml for each strain have been performed in LB. Growth was quantified by absorbance at 600 nm and measured every 30 min. Four independent biological replicates for each strain were used. The time of growth detection was defined as an increase of 0.1 unit of absorbance at 600 nm, and recorded for each dilution. The Ln of the dilutions as a function of the time for growth detection is indicated. Similar slopes indicate similar growth rates (see Methods section for details). Differences were not significant (p = 0.92, Student t-test).

