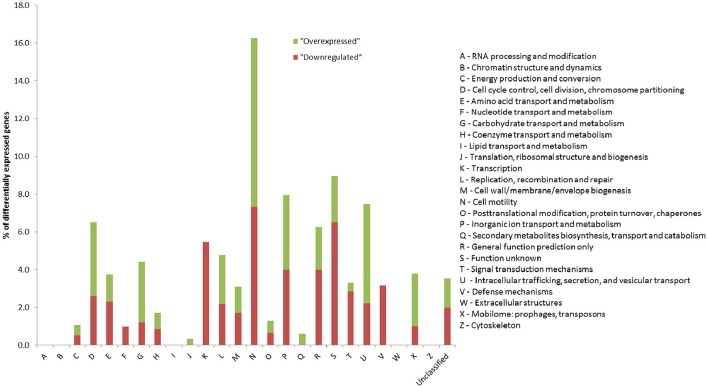
Figure 6.
Classification by COG (cluster of orthologous group) annotation of the 208 genes differentially expressed between P. luminescens overexpressing dam and the control strain. Results show the percentage of genes from each COG class differentially expressed between the P. luminescens dam-overexpressing strain and the control strain, according to the 2014 update (ftp://ftp.ncbi.nih.gov/pub/COG/COG2014/static/lists/homeCOGs.html).

