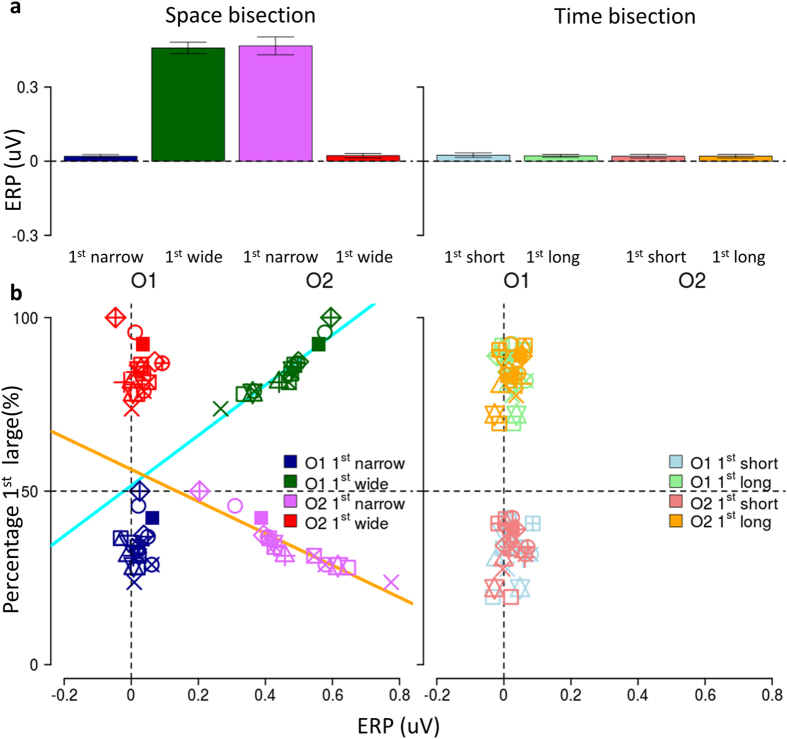
Figure 4.
Relationship between early occipital response and position of second sound. (a) Average amplitude across subjects of early response, estimated as mean voltage in the time window between 50 and 90 ms after the sound. On the left, spatial bisection: average of trials in which S2 is presented in the left or in the right hemispace (mean ± SEM). On the right, temporal bisection: average trials with S2 presented with shorter or longer temporal separation from S1. (b) Correlation between the relative localization of the second sound with mean ERP amplitude. Individual mean ERP amplitude in the 50–90 ms time window plotted against the percentage of perceiving the first interval larger for spatial bisection task (left) and temporal bisection task (right) in O1 (blue and green) and O2 (red and pink). Each point corresponds to a single subject and the percentage was computed for the two separate spatial and temporal intervals. Cyan and orange lines represent significant correlation.

