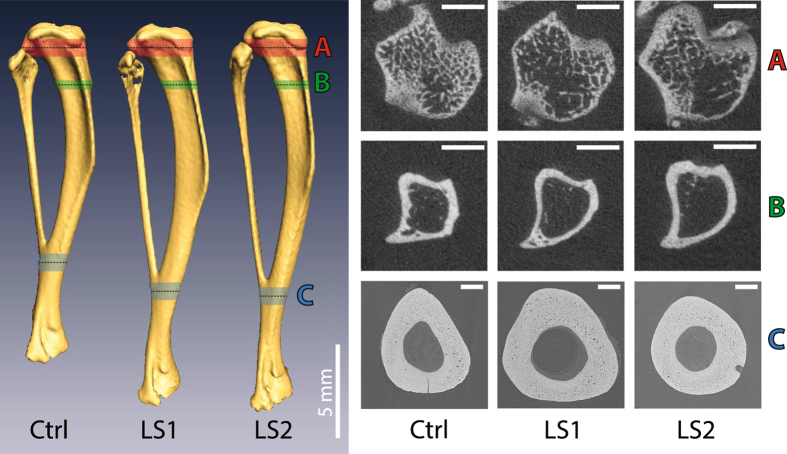
Figure 2.
Representative tibiae and cross-sections. Whole tibiae are shown on the left, with the location and size of the stacks used for µCT analyses of trabecular bone (A, red), proximal cortical bone (B, green), and distal diaphysis cortical bone (C, blue). The black dashed lines indicate the middle of each stack, where the transverse sections shown on the right were taken. Scale bar for A and B = 1 mm, for C = 250 µm. Abbreviations: Ctrl: Control, LS1: Longshanks 1, LS2: Longshanks 2.

