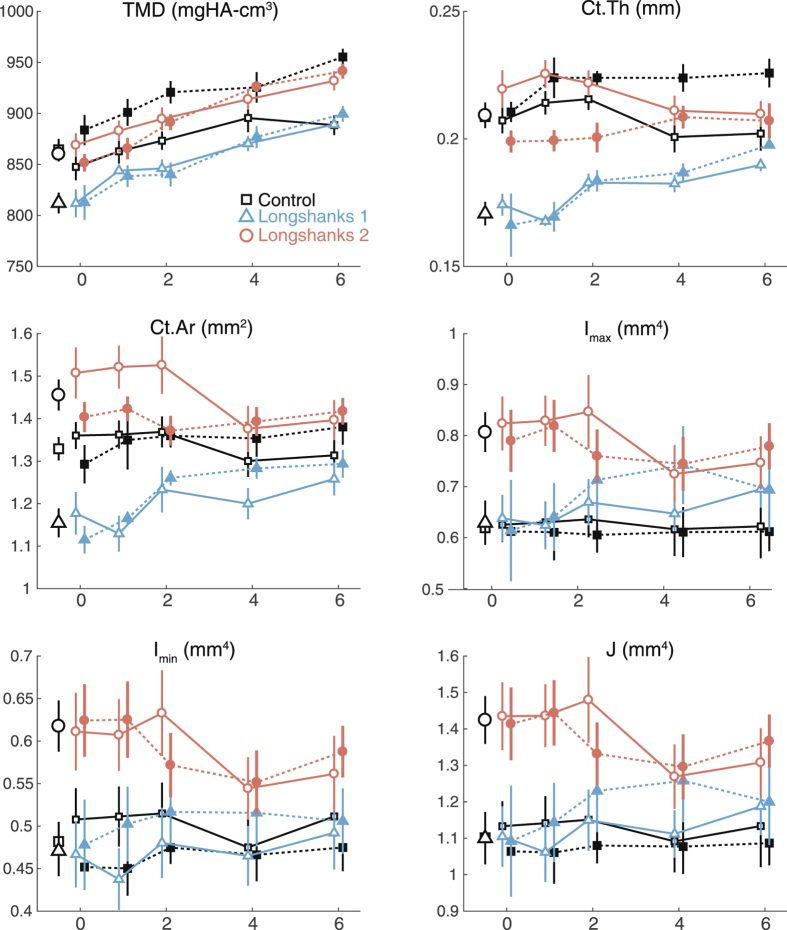
Figure 3.
Longitudinal changes in proximal cortical morphology by line and treatment. X-axis represents time in weeks. Data are shown as means with vertical bars representing standard errors. Within line, treatments are shown as filled symbols with solid lines (OVX) or open symbols with dashed lines (SHAM). Treatments are offset for clarity. Control mice are in black squares, LS1 mice in red circles, LS2 mice in blue triangles. Larger open symbols on the left represent baseline means obtained from pooled samples by line at week 0. For significance tests of differences in baseline means among lines, see Table 1. For significance tests of mean differences between treatments within line, and mean differences relative to baseline within line and treatment, see Supplementary Table 1.

