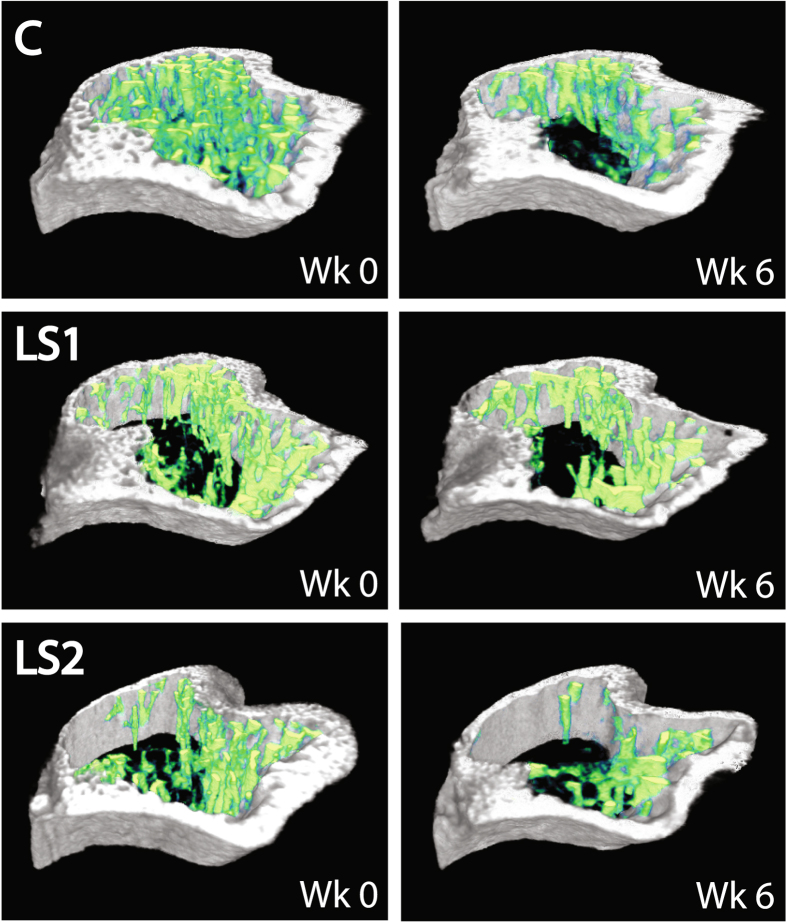
Figure 5.
Representative transverse sections of the left proximal tibia in ovariectomized Control (C), Longshanks 1 (LS1) and Longshanks 2 (LS2) mice. The sections were taken from uCT scans at week 0 (Wk 0) and week 6 (Wk 6) of the experiment, starting ~0.18 mm distal to the end of the growth plate, and extending 0.625 mm distally (50 slices). For orientation, the projection at the bottom left of each section is the tibial tuberosity, while the two rounded projections at the top right are the caudal aspects of the tibial condyles. Cortical bone is shown in gray, trabecular bone in green. Note the more sparse, thinner trabeculae in Longshanks mice compared with Control, the relatively greater loss of trabecular bone in ovariectomized Control mice, as well as the relatively thinner cortex in LS1. Not to scale.

