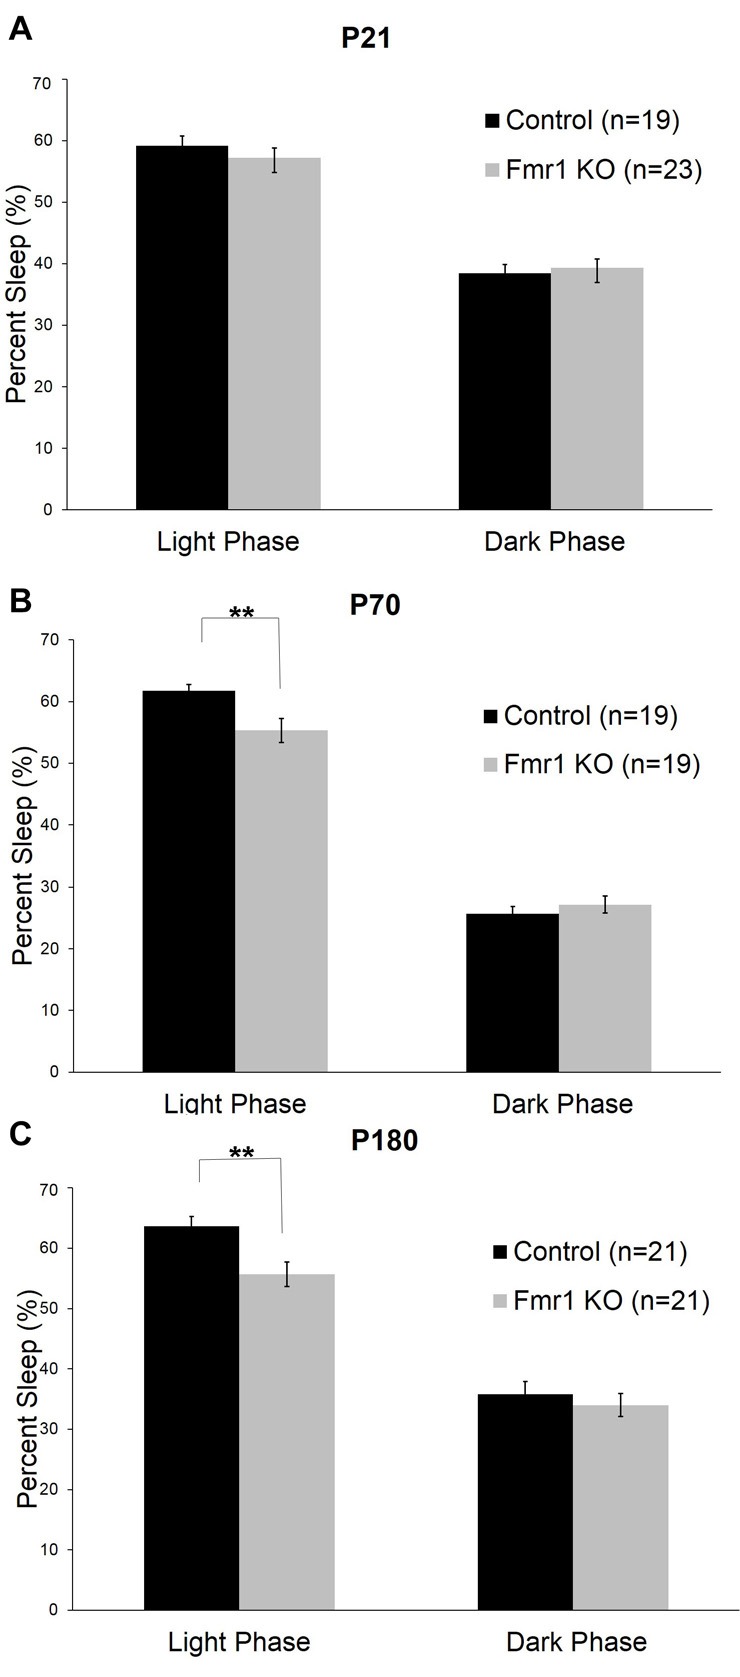
Figure 2.

Sleep duration in control and Fmr1 KO mice in light and dark phases. Bars are the means ± SEM of sleep averaged across Days 2–6 of the number of animals indicated in parentheses. For each variable, full results of repeated measures (RM) ANOVA are reported in Table 1. **Denotes p < 0.01. (A) At P21, there were no differences between the genotypes in sleep duration in light and dark phases. (B) At P70, the genotype × phase interaction was statistically significant (p < 0.001). Post hoc t-tests indicate that Fmr1 KO (n = 19) animals had less sleep than controls (n = 19) in the light phase (p = 0.005). (C) At P180, the genotype × phase interaction was statistically significant (p = 0.015). Post hoc t-tests indicate that Fmr1 KO animals (n = 21) than controls (n = 21) in the light phase (p = 0.004).
