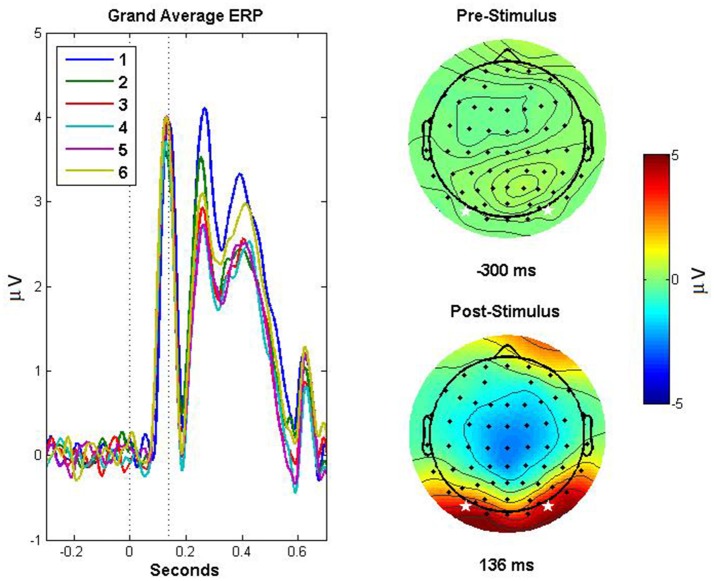
Figure 1.
Event related potentials demonstrating repetition suppression effect and scalp topography. ERPs based on the average of channels PO7 and PO8, for each exposure (1–6) to the stimuli, are depicted in the left panel. The dotted lines indicate (from left to right) the onset of the stimulus and the peak amplitude of the grand-average ERP across exposures, corresponding to the P1 component. The right panels depict topographic plots for pre- (top right) and post-stimulus (bottom right) activity, with the stars indicating the electrodes that were averaged to obtain the ERPs depicted in the left panel. The post stimulus scalp map depicts the activity 136 ms post stimulus, corresponding to the peak amplitude in the grand average ERP.

