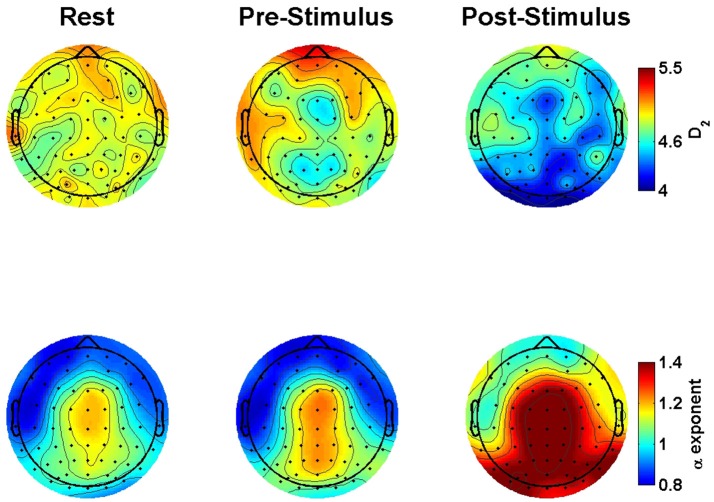
Figure 6.
Group-averaged correlation dimension and scaling exponents scalp maps comparing rest to pre- to post-stimulus. The maps show the estimated correlation dimension (top) and scaling exponents (bottom) as a function of resting conditions (left), prior to (middle) and following (right) stimulus onset.

