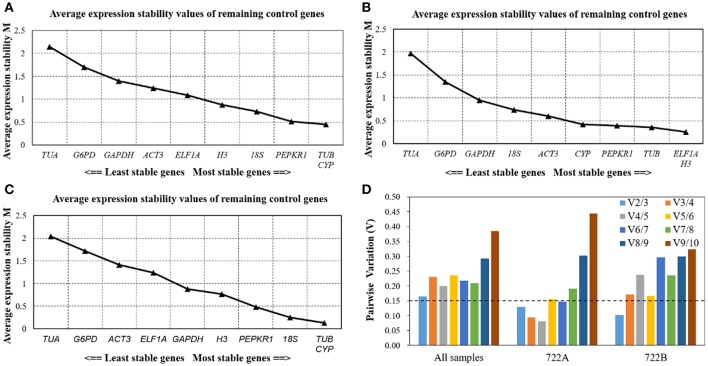
Figure 4.
Stability ranking and pairwise variation (V) analysis of the 10 candidate reference genes in different sample sets using GeNorm. The average expression stability values (M) of the 10 candidate reference genes performed in all sample (A), 722A sample set (B), 722B sample set (C), The most stable genes are on the right, and the least stable gene are on the left. The optimal number of reference genes required for accurate normalization (D). GeNorm was used to analyze pairwise variation (Vn/Vn+1) between the normalization factors NFn and NFn+1, V-value < 0.15 denotes that additional reference genes will not significantly improve the accuracy of the results.

