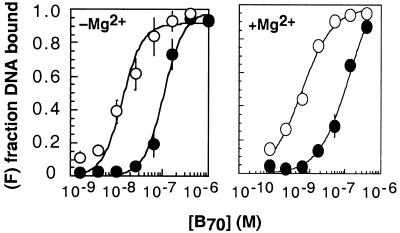
Figure 4.
Role of Mg2+ in CRE/AP-1 specificity. Binding isotherms illustrating the CRE24 (open symbols)/AP-123 (closed symbols) specificity of B70 (CREB271–341) in the presence and absence of 10 mM Mg2+. The plot illustrates the fraction of DNA bound (F) as a function of B70 concentration at 25°C. The curves represent the best fit of the data to the equation described in the legend to Figure 2. Each plot represents the average of at least three independent determinations. Error bars represent the standard error.

