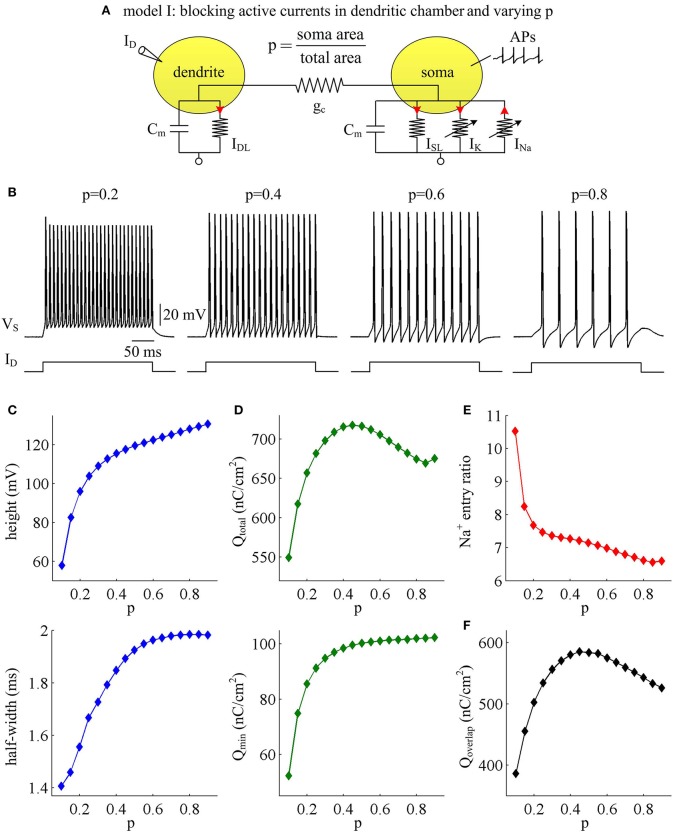
Figure 1.
AP shape and metabolic efficiency vary with dendrite area in model I. (A) Schematic of model I. There are no active channels in its dendritic chamber. Red arrows indicate the direction of ionic current. We set coupling conductance to and vary morphological parameter p. (B) Responses of membrane voltage VS recorded from the soma with different values of p, which are indicated on the top of each panel. (C) Both height and half-width of the AP increase as a function of p. (D) Top panel: total Na+ load Qtotal during an AP is plotted as a function of p. Note that Qtotal reaches a maximum with moderate value of p. Bottom panel: minimal Na+ load Qmin increases as a function of p. (E) Na+ entry ratio decreases as a function of p. (F) Overlap Na+ load Qoverlap during an AP is plotted as a function of p. Similar to Qtotal, Qoverlap also reaches a maximum with moderate value of p. Dendritic input is .

