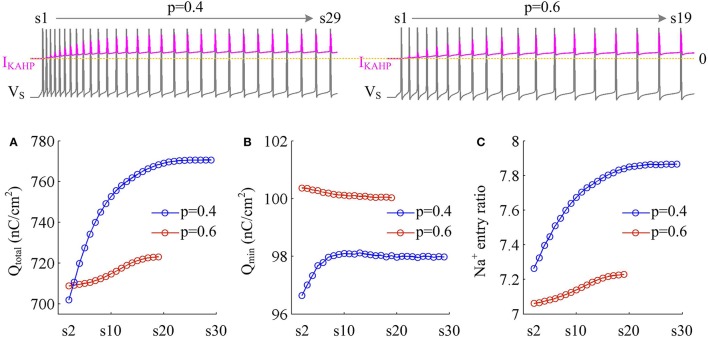
Figure 10.
Metabolic efficiency of the AP is reduced as IKAHP is activated. (A) Total Na+ load Qtotal, (B) minimal Na+ load Qmin, and (C) Na+ entry ratio are respectively calculated for each AP during the activation of IKAHP with p = 0.4 and 0.6. Top panels show the response of VS (gray) and IKAHP (pink) recorded in the model III with each value of p. Note that our examination starts from the 2nd AP, since IKAHP is totally unactivated during the 1st AP. and .

