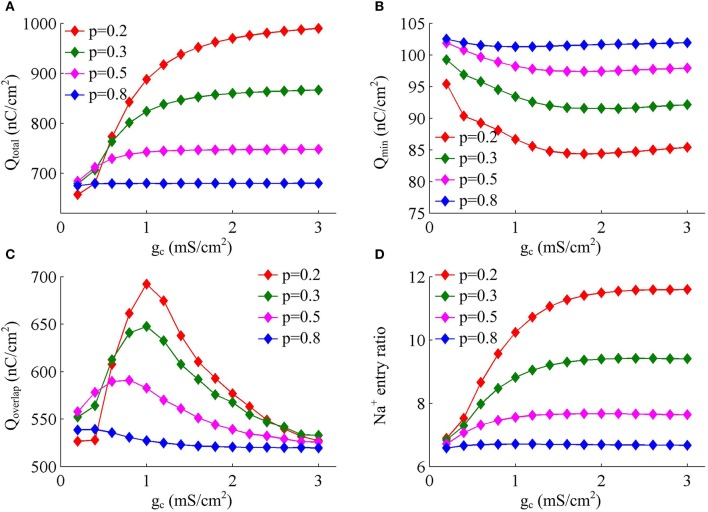
Figure 4.
Increasing coupling conductance between chambers reduces AP efficiency in model I. (A) Total Na+ load Qtotal, (B) minimal Na+ load Qmin, (C) overlap Na+ load Qoverlap, and (D) Na+ entry ratio are respectively plotted as a function of gc in model I. The value of p is 0.2, 0.3, 0.5, and 0.8. Dendritic input is 2μA/cm2. Since applied ID alters the final output of model I neuron, the items for an AP examined here are different from those with same p and gc in Figures 1D–F.

